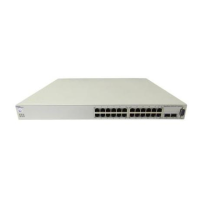
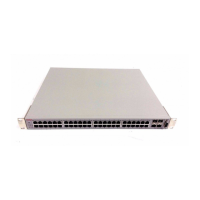
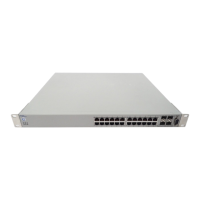
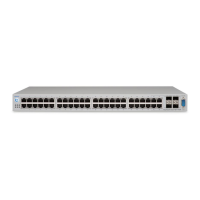
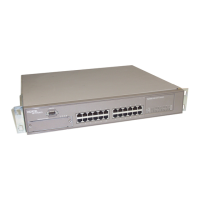
Do you have a question about the Nortel 5510 and is the answer not in the manual?
Lists other documentation for the switch series, including installation and configuration guides.
Instructions for checking for documentation and software updates online via provided links.
Covers configuring and viewing system event logs using CLI and JDM for debugging and analysis.
Details configuring remote logging of system messages to a central syslog server.
Explains port-based and address-based traffic monitoring configurations for network analysis.
Describes viewing switch statistical information and generating graphs via the Java Device Manager.
Outlines CLI commands for displaying diagnostic and statistical information from the switch.
Explains how to test stack ports and cables using internal and external loopback tests for troubleshooting.
Details viewing diagnostic and statistical information via the web interface, covering various statistics.
Describes CLI commands for configuring and managing RMON alarms, events, history, and statistics.
Guides on setting RMON fault thresholds, creating alarms, and viewing event logs via web interface.
Explains how RMON alarms are defined, work, and are created or deleted using thresholds and events.
Details global configuration, flow setup, collectors, and ports for IPFIX via JDM.
Covers CLI commands for configuring IPFIX collectors, slots, ports, and viewing collected data.
Guides on configuring IPFIX globally and for individual ports via the web interface.
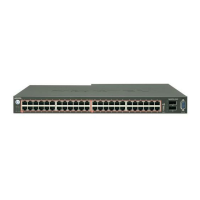
| Model | 5510 |
|---|---|
| Type | Switch |
| Uplink Ports | 4 |
| VLANs | 4094 |
| Stacking | Yes |
| Management | Web, CLI, SNMP |
