32 Chapter 1 General System Monitoring Considerations
Field Description
UnitNoResourcesPktsDropped The number of packets dropped on stack up/down ports on this
unit due to a lack of resources.
Graphing switch chassis data
The JDM provides the ability to view switch statistical information in a
variety of graphs.
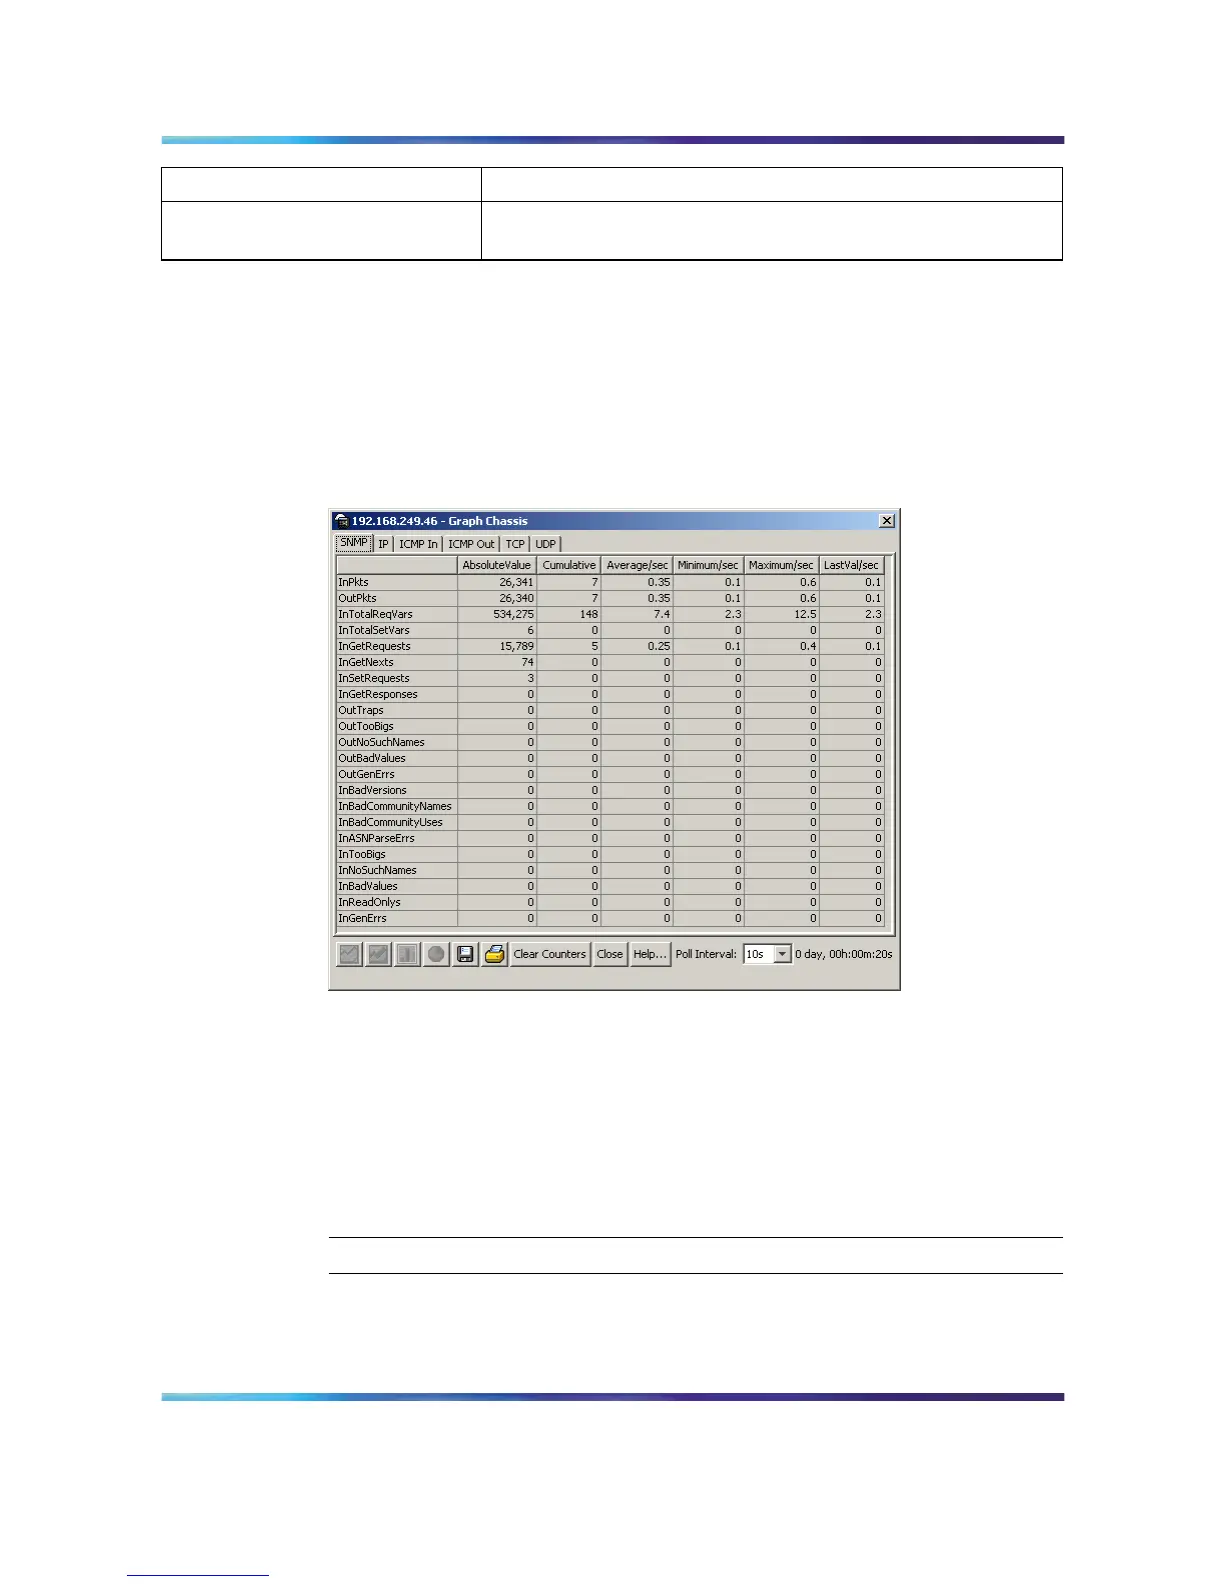
To make use of these capabilities, open the Graph Chassis screen by
selecting Graph > Chassis from the menu. This screen is illustrated below.
Graph Chassis screen
The following sections describe the informational tabs on this screen and
the type of data each represents. Refer to "Creating a graph" (page 69) for
the procedure to graph this data.
SNMP tab
The SNMP tab provides read-only statistical information about SNMP traffic.
To view the SNMP tab, follow this procedure:
Step Action
1
Open the Graph Chassis screen by selecting Graph > Chassis
from the menu. The Graph Chassis screen opens with the SNMP
tab selected. This screen is illustrated below.
Nortel Ethernet Routing Switch 5500 Series
Configuration - System Monitor ing
NN47200-505 03.01 Standard
5.1 27 August 2007
Copyright © 2005 - 2007, Nortel Networks
.
 Loading...