Operator’s Manual – OPTI CCA-TS2 pH-3
ANALYTES pH
Whole Blood
Within-run precision in whole blood samples was evaluated at 3 different concentrations on one OPTI
CCA-TS2. The table below shows the Averages, Standard Deviations and % CV calculated from 10
samples for each level.
pH Whole Blood
Level 1 Level 2 Level 3
Average 7.134 7.341 7.518
St. Dev 0.004 0.006 0.009
%CV 0.05% 0.08% 0.13%
n 10 10 10
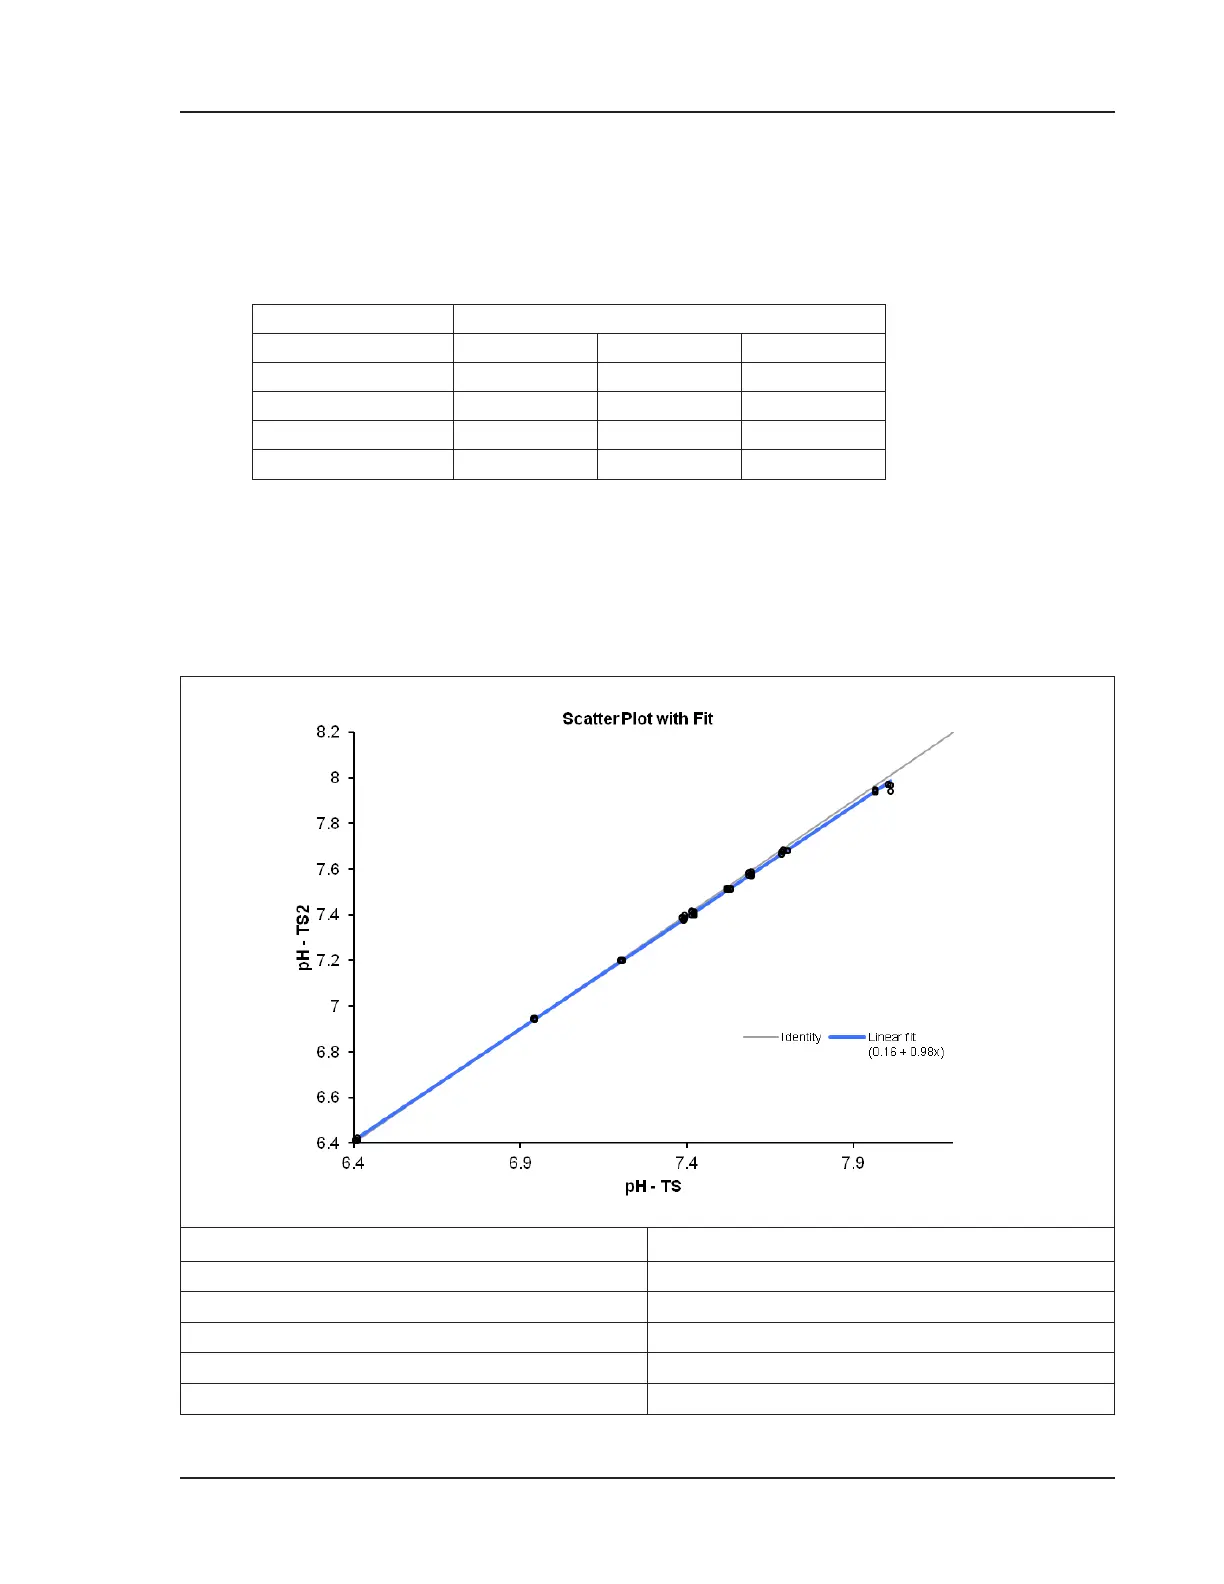
Linearity
Wherever possible, linearity for the OPTI CCA-TS2 measurement has been established against reference
materials or methods. The linearity of the pH sensor on the OPTI CCA-TS2 has been established versus
the same sensor on the OPTI CCA-TS using whole blood samples tonometered with different %CO
2
gas
mixtures to establish the correlation.
Parameter and Specication Value
Number of Samples 81
Slope 0.98
Offset 0.16
R
2
1.000
Sy|x 0.009