Operator’s Manual – OPTI CCA-TS2 PCO2-5
ANALYTES PCO
2
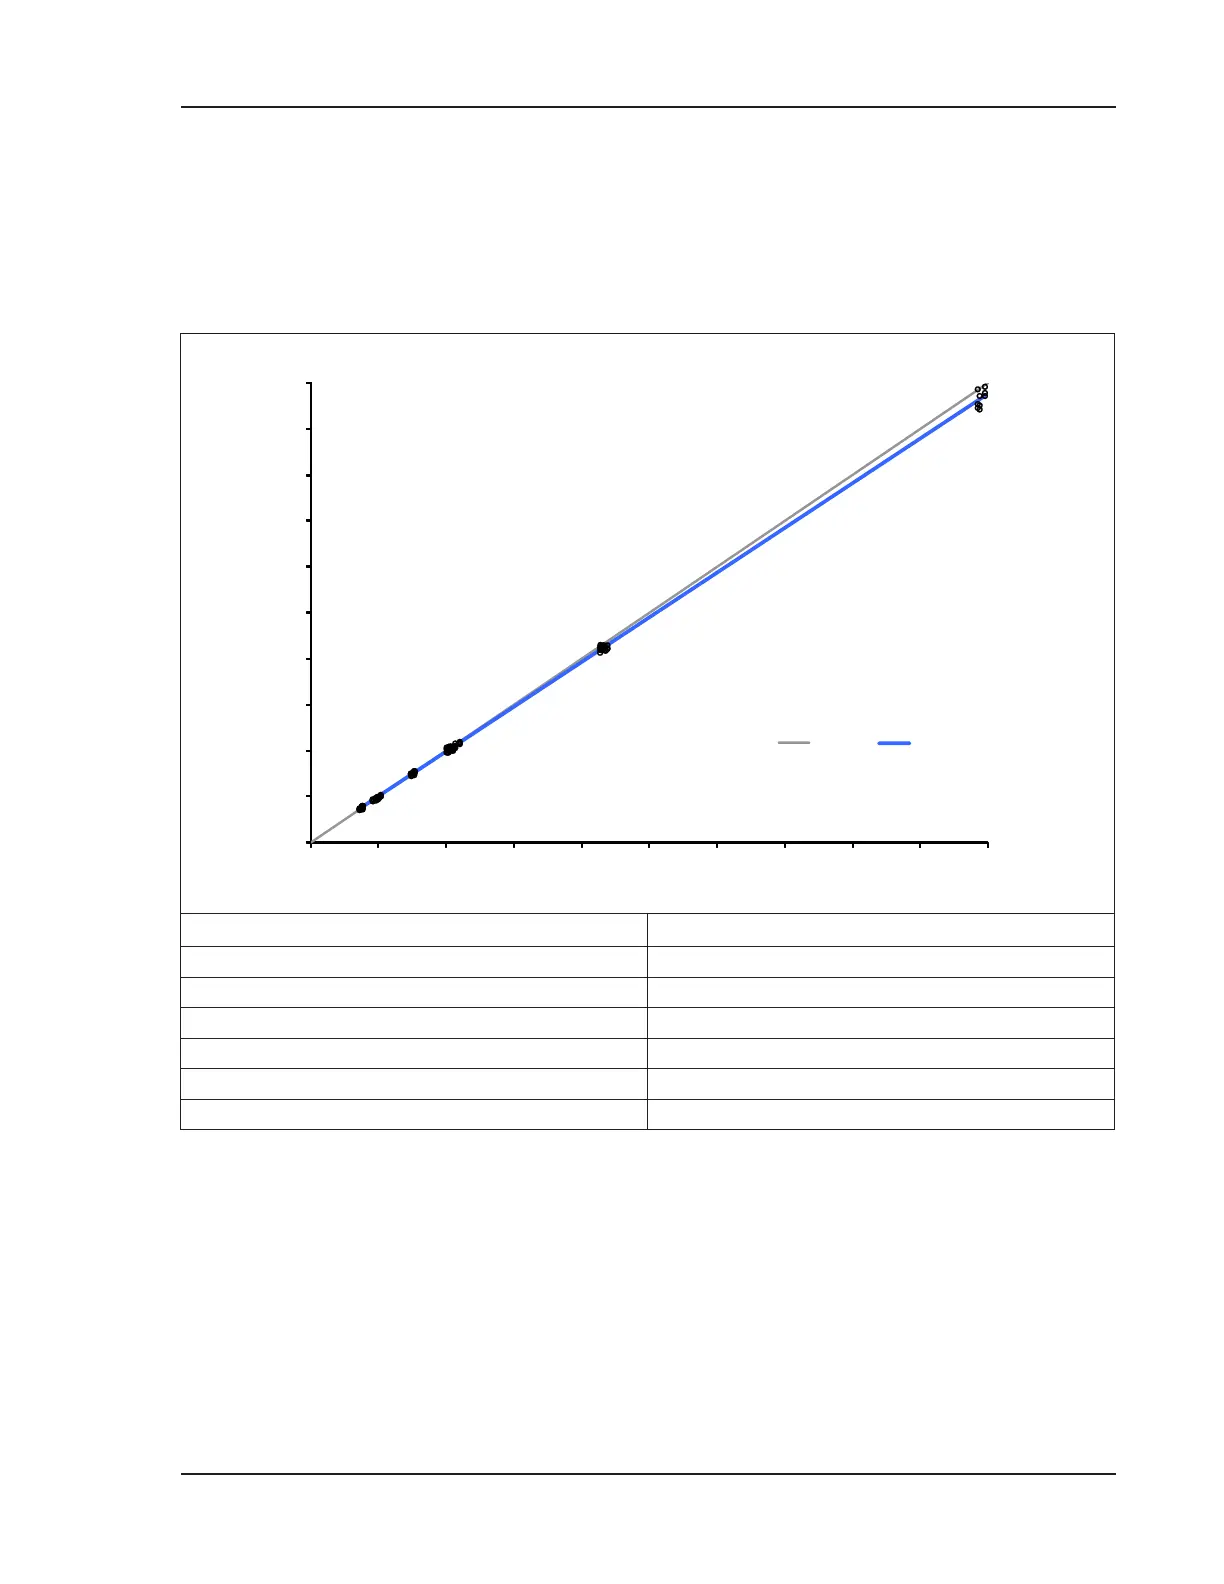
OPTI CCA-TS2 vs OPTI CCA-TS on whole blood in a typical setting
In Method Comparisons carried out following the experimental protocol recommended in the CLSI
guideline EP9-A2, Volume 15, Number 19 using whole blood samples on the OPTI CCA-TS2 versus the
OPTI CCA-TS.
Parameter and Specication Value
Number of Samples 117
Range 14.3 to 198.9
Slope 0.97
Offset 0.87
R
2
0.999
Sy|x 1.114
References
1. Tietz, Norbert W., Ed., ClinicalGuidetoLaboratoryTests, 2nd Ed., (Philadelphia: W.B.Saunders,
Co., 1990) p. 436
.
2. Vurek GG, Feustel PJ, Severinghaus JW, AFiberOpticPCO
2
Sensor, Ann.Biomed.Eng. 11, p.499,
1983.
3. OPTI Medical. Model equation for regression statistics is: [results of OPTI Analyzer] = slope(m)
[comparative method results] + intercept(b).
0
20
40
60
80
100
120
140
160
180
200
0 20 40 60 80 100 120 140 160 180 200