PCO2-B-6 Operator’s Manual – OPTI CCA-TS2
PCO
2
(Dry Sensor) ANALYTES
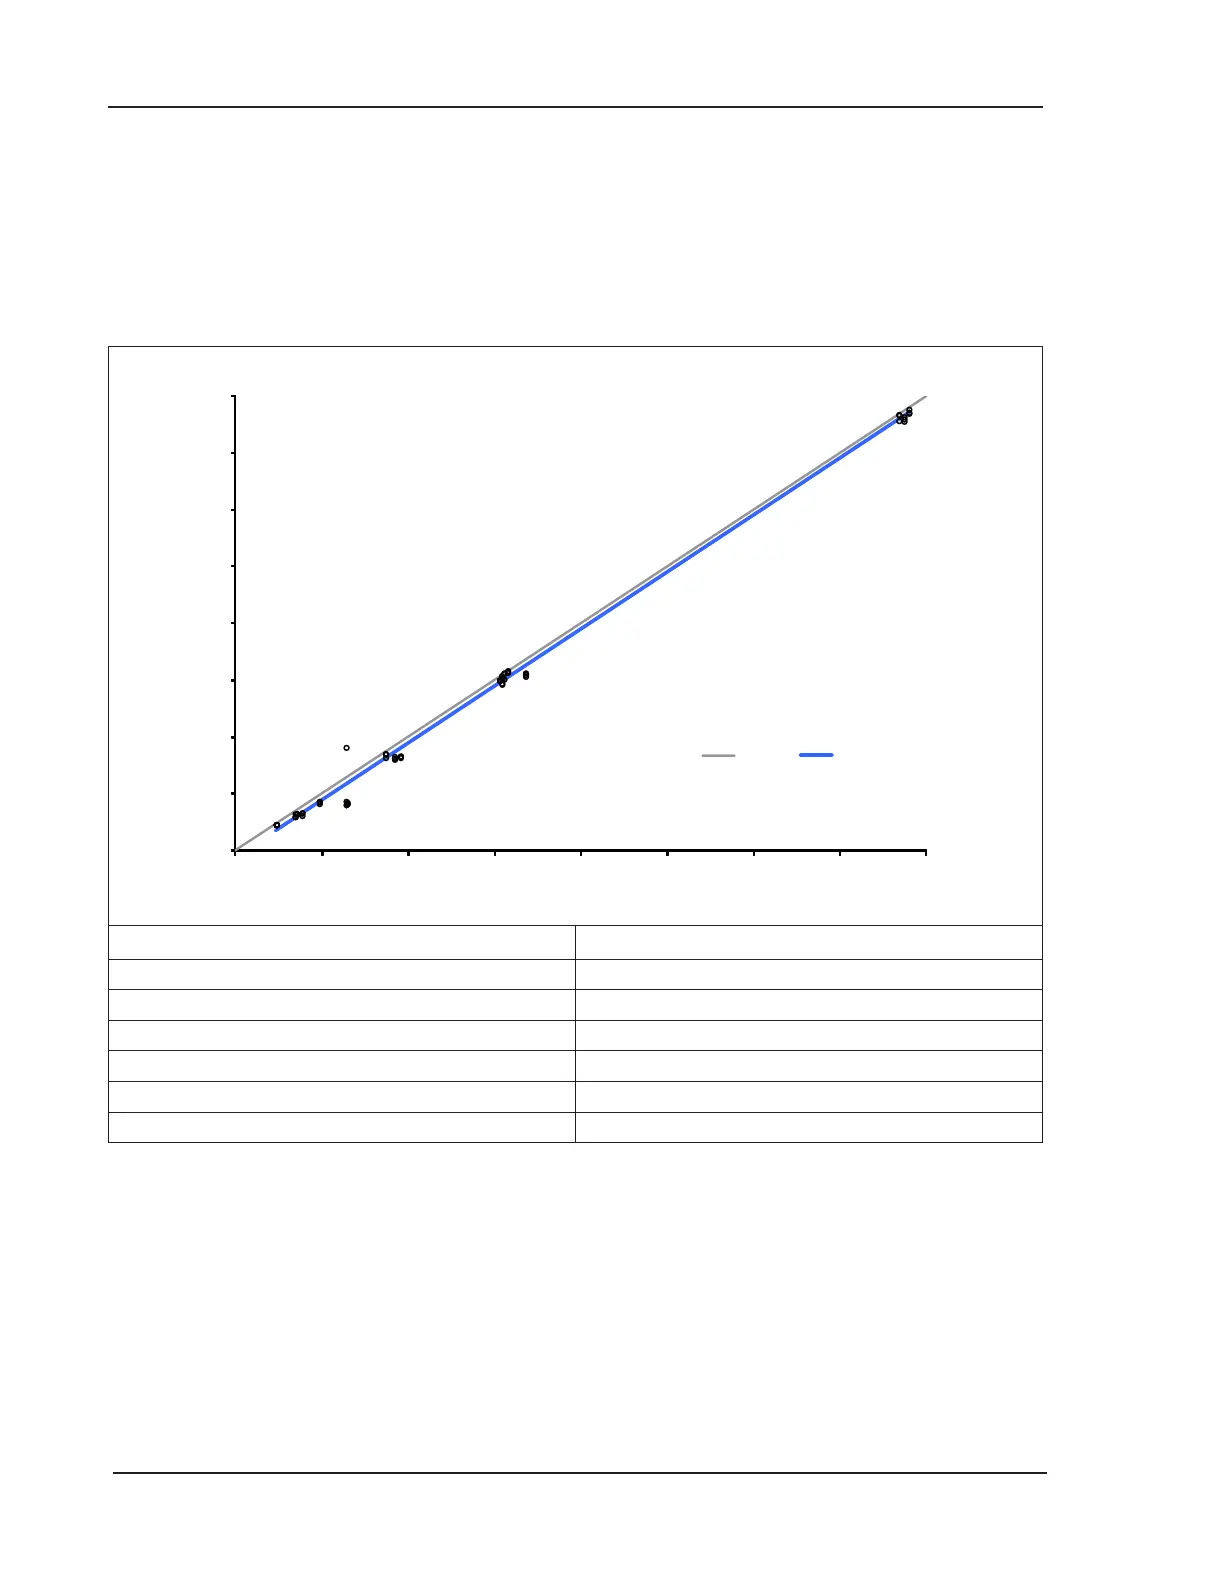
OPTI CCA-TS2 vs OPTI CCA-TS on whole blood in a typical setting
In Method Comparisons carried out following the experimental protocol recommended in the CLSI
guideline EP9-A2, Volume 15, Number 19 using whole blood samples on the OPTI CCA-TS2 versus the
OPTI CCA-TS.
Parameter and Specication Value
Number of Samples 63
Range 14.7 to 87.9
Slope 1.00
Offset -1.13
R
2
0.995
Sy|x 1.523
References
1. Tietz, Norbert W., Ed., ClinicalGuidetoLaboratoryTests, 2nd Ed., (Philadelphia: W.B.Saunders,
Co., 1990) p. 436
.
2. OPTI Medical. Model equation for regression statistics is: [results of OPTI Analyzer] = slope(m)
[comparative method results] + intercept(b).
10
20
30
40
50
60
70
80
90
10 20 30 40 50 60 70 80 90
Linear fit
(-1.13 + 1.00x)