Operator’s Manual – OPTI CCA-TS2 PO2-5
ANALYTES PO
2
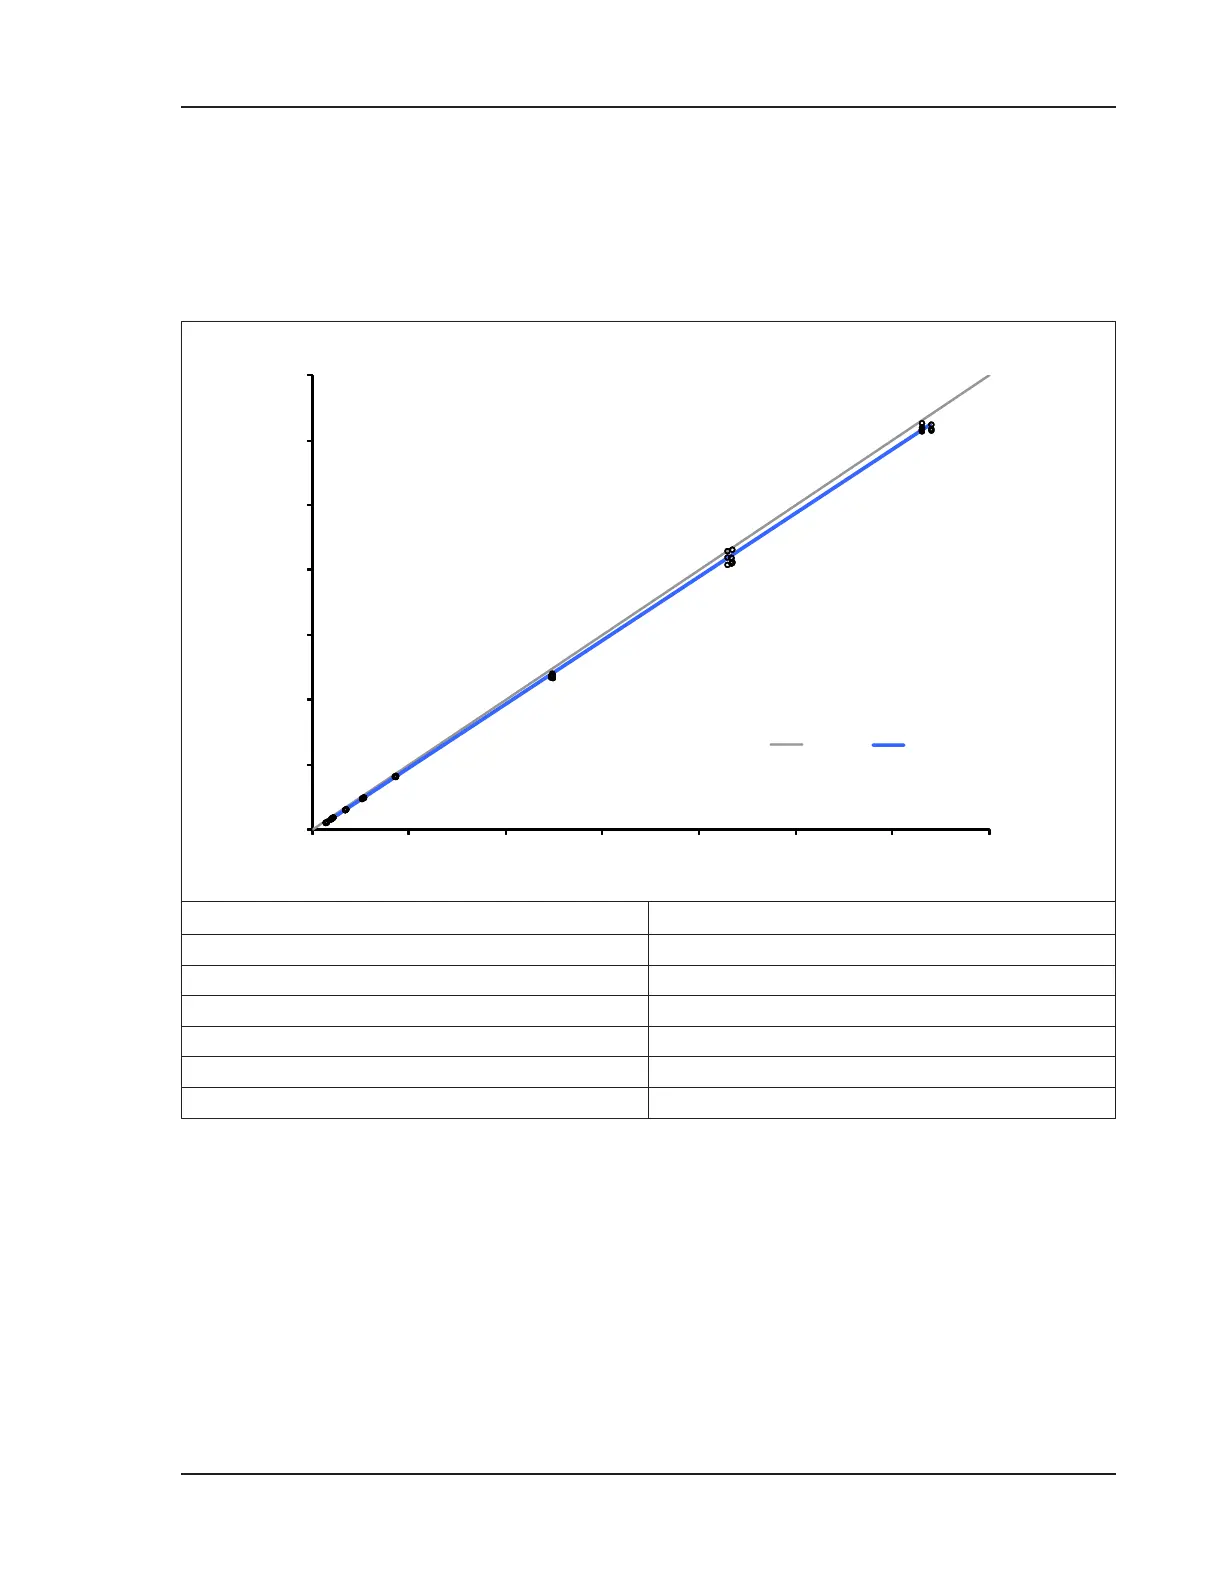
OPTI CCA-TS2 vs OPTI CCA-TS on whole blood in a typical setting
In Method Comparisons carried out following the experimental protocol recommended in the CLSI
guideline EP9-A2, Volume 15, Number 19 using whole blood samples on the OPTI CCA-TS2 versus the
OPTI CCA-TS.
Parameter and Specication Value
Number of Samples 144
Range 13.5 to 639.9
Slope 0.98
Offset -1.82
R
2
0.999
Sy|x 3.931
References
1. Tietz, Norbert W., Ed., ClinicalGuidetoLaboratoryTests, 2nd Ed., (Philadelphia: W.B.Saunders,
Co., 1990) p. 436
.
2. Kautsky H, QuenchingofLuminescencebyOxygen, Transactions Faraday Society 35, p.216, 1939
3. CDI, 3MHealthcareSystem200ExtracorporealBloodGasMonitor. See, for example, Lubbers DW,
Gehrich J, Opitz N,
FiberOpticsCoupledFlourescenceSensorsforContinuousMonitoringofBlood
GasesintheExtracorporealCircuit, Life Supports Systems 4, p.94, 1986.
4. OPTI Medical. Model equation for regression statistics is: [results of OPTI Analyzer] = slope(m)
[comparative method results] + intercept(b).
0
100
200
300
400
500
600
700
0 100 200 300 400 500 600 700
Linear fit
(-1.82 + 0.98x)
 Loading...