Ca-6 Operator’s Manual – OPTI CCA-TS2
CALCIUM ANALYTES
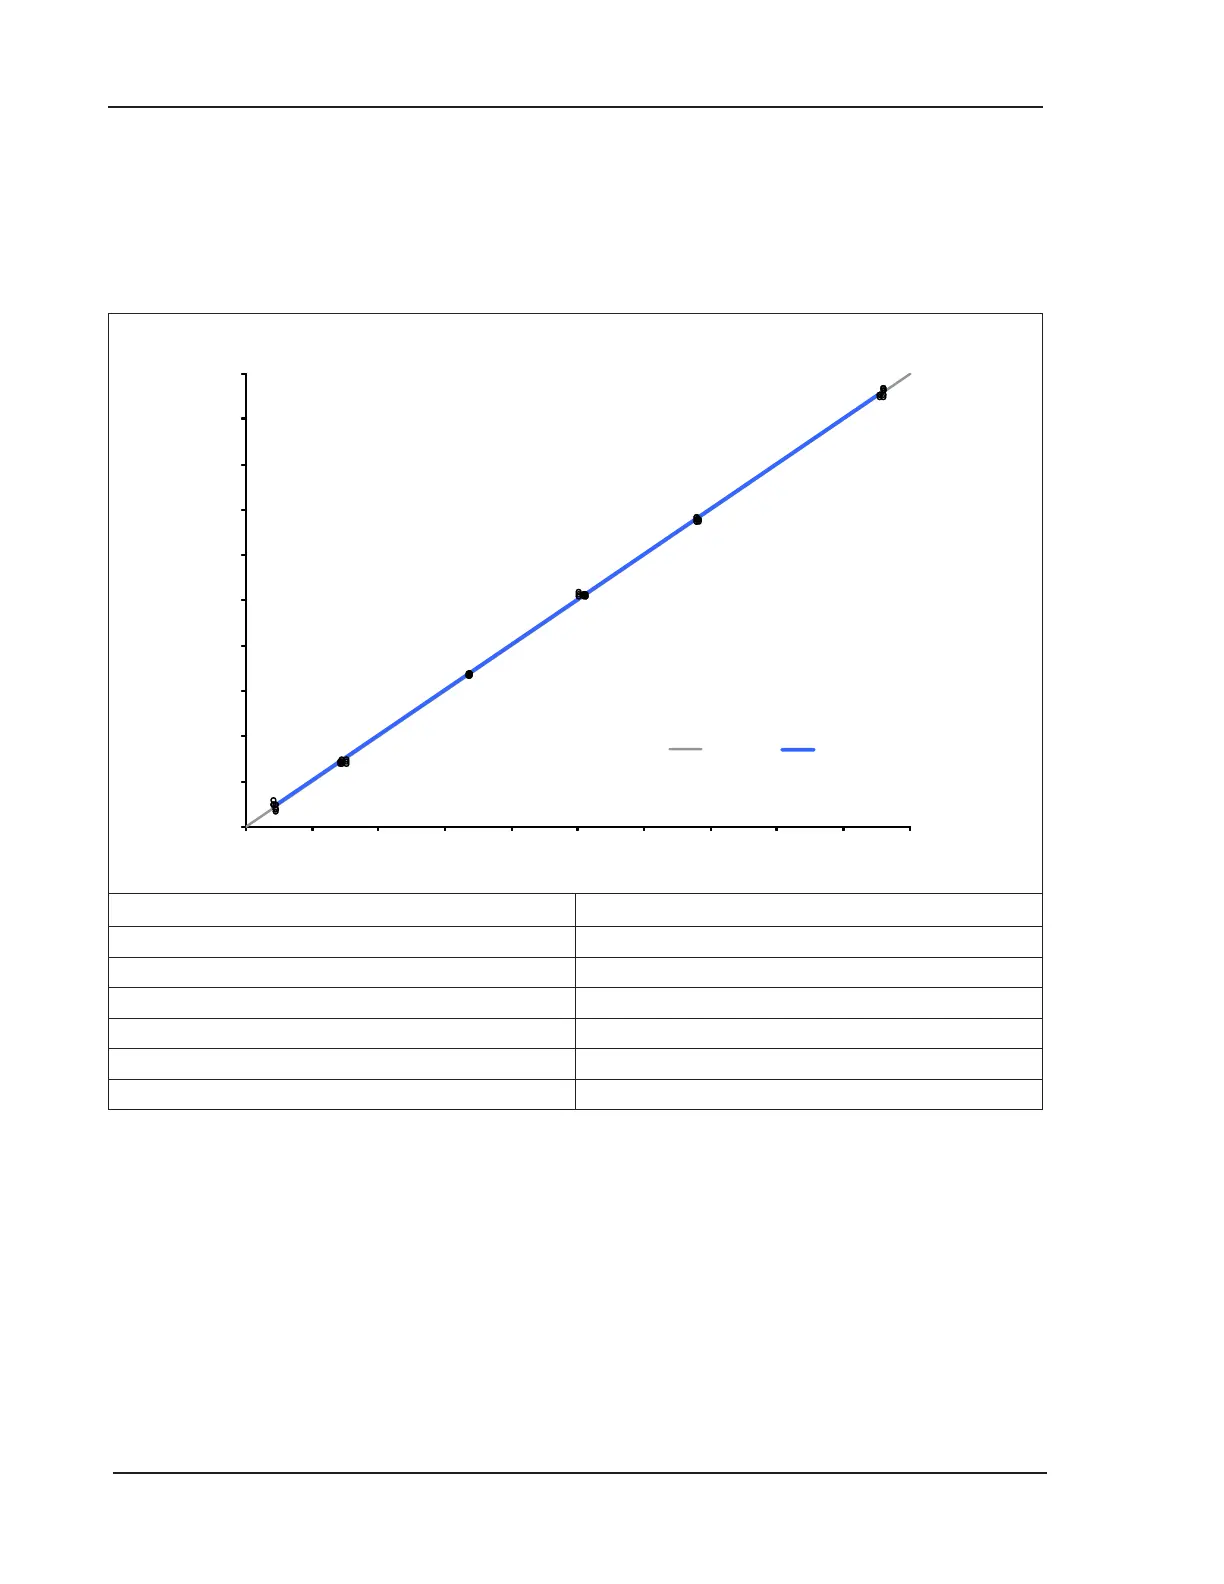
OPTI CCA-TS2 vs OPTI CCA-TS on whole blood in a typical setting
In Method Comparisons carried out following the experimental protocol recommended in the CLSI
guideline EP9-A2, Volume 15, Number 19 using whole blood samples on the OPTI CCA-TS2 versus the
OPTI CCA-TS.
Parameter and Specication Value
Number of Samples 54
Range 0.28 to 2.12
Slope 1.00
Offset 0.00
R
2
0.999
Sy|x 0.013
References
1. Tietz, Norbert W., Ed., ClinicalGuidetoLaboratoryTests, 2nd Ed., (Philadelphia: W.B.Saunders,
Co., 1990) p. 436
.
2. Burritt MF, Pierides AM, Offord KP: Comparativestudiesoftotalandionizedserumcalciumvalues
innormalsubjectsandinpatientswithrenaldisorders. Mayo Clinic proc. 55:606, 1980.
3. Tsien R, NewCalciumIndicatorsandBufferswithHighSelectivityAgainstMagnesiumandProtons,
Biochemistry 19, p.2396-2404, 1980
.
4. OPTI Medical. Model equation for regression statistics is: [results of OPTI Analyzer] = slope(m)
[comparative method results] + intercept(b).
0.2
0.4
0.6
0.8
1
1.2
1.4
1.6
1.8
2
2.2
0.2 0.4 0.6 0.8 1 1.2 1.4 1.6 1.8 2 2.2