Operator’s Manual – OPTI CCA-TS2 THB/SO2-5
ANALYTES tHb/SO
2
Linearity
Wherever possible, linearity for the OPTI CCA-TS measurement has been established against reference
materials or methods. Total hemoglobin content linearity is established by the photometric determination
of cyanmethemoglobin
5
. No standard method exists for the measurement of oxygen saturation. No
changes were made to the tHb measurement principle, so the linearity of the OPTI CCA-TS2 is equivalent
to the OPTI CCA-TS
.
Correlation
Slope Intercept Correlation
Coefcient
Sy.x Range n
tHb (g/dL) 0.984 0.165 0.995 0.59 5.2 to 22.0 84
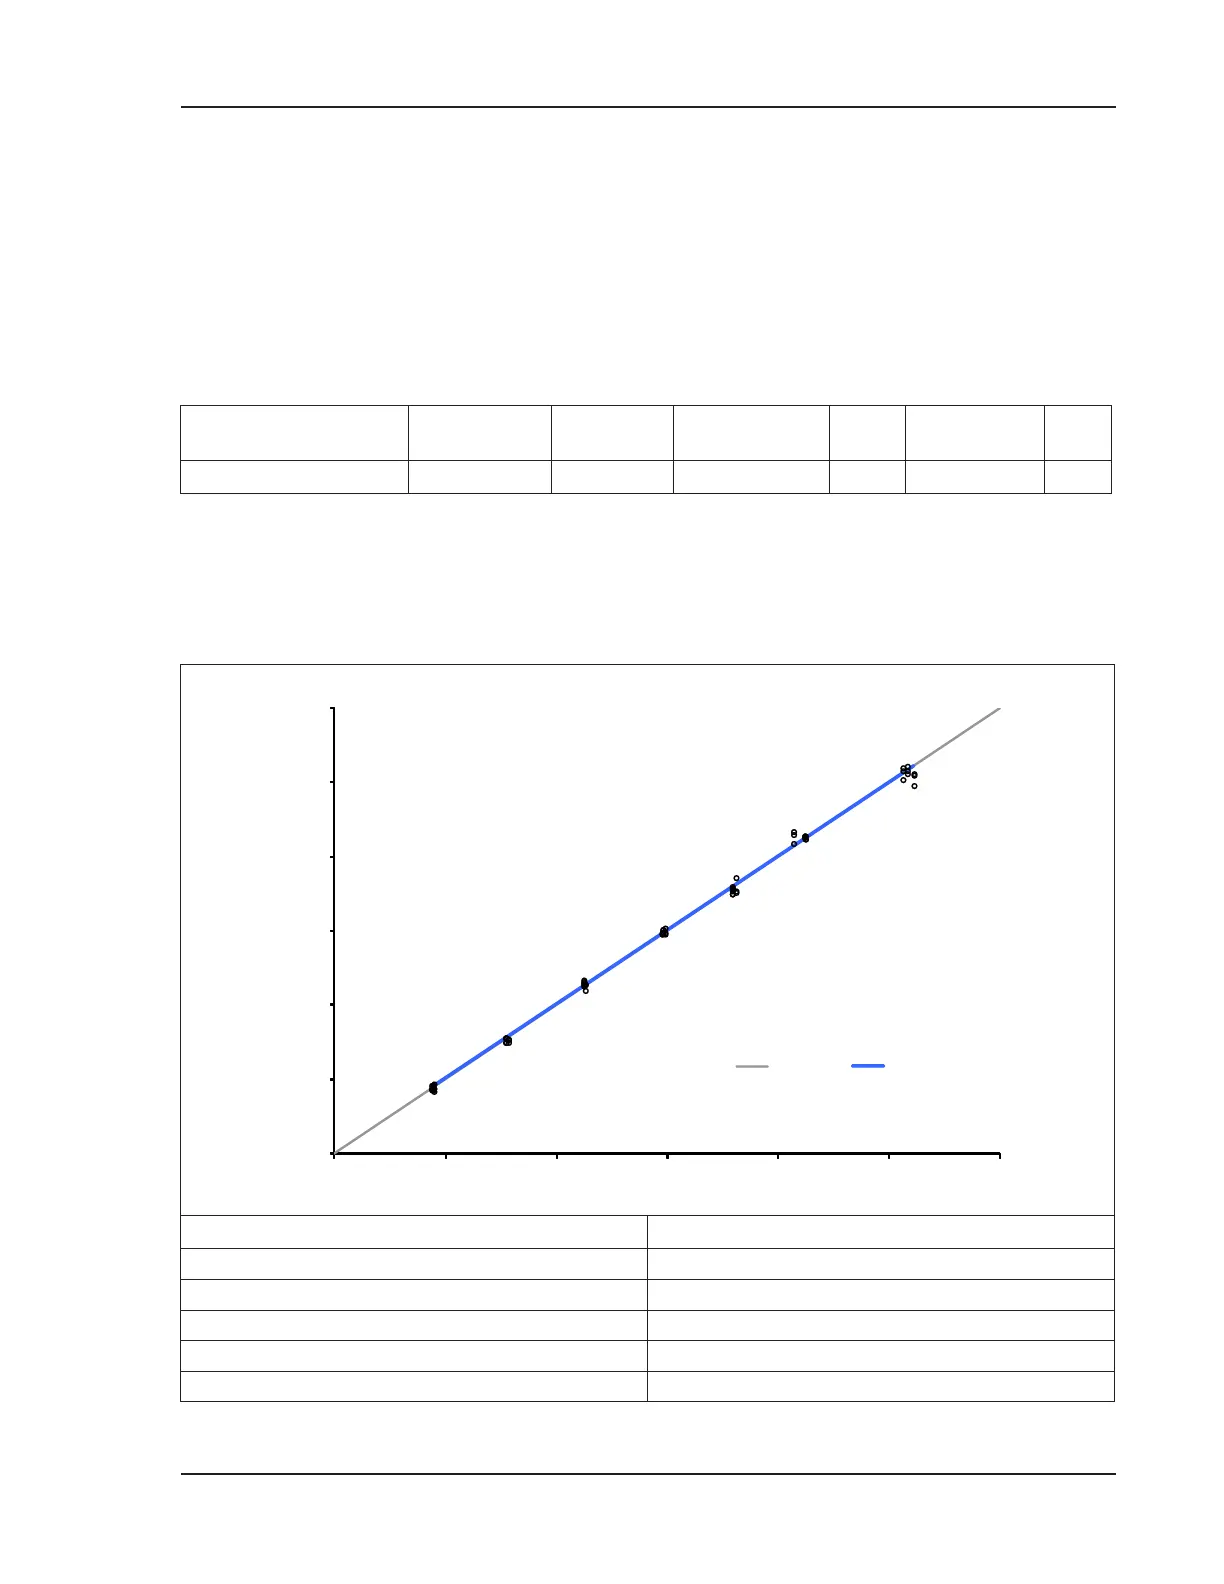
Wherever possible, linearity for the OPTI CCA-TS2 measurement has been established against reference
materials or methods. The linearity of the tHb measurement on the OPTI CCA-TS2 has been established
versus the OPTI CCA-TS using whole blood samples that were prepared with different amounts of red
blood cells and tonometered with a mid level %O
2
/%CO
2
gas to establish the correlation.
Parameter and Specication Value
Number of Samples 63
Slope 0.99
Offset 0.10
R
2
0.997
Sy|x 0.343
0
5
10
15
20
25
30
0 5 10 15 20 25 30