CHAPTER EIGHT
DPOAE test
72
DPOAE test
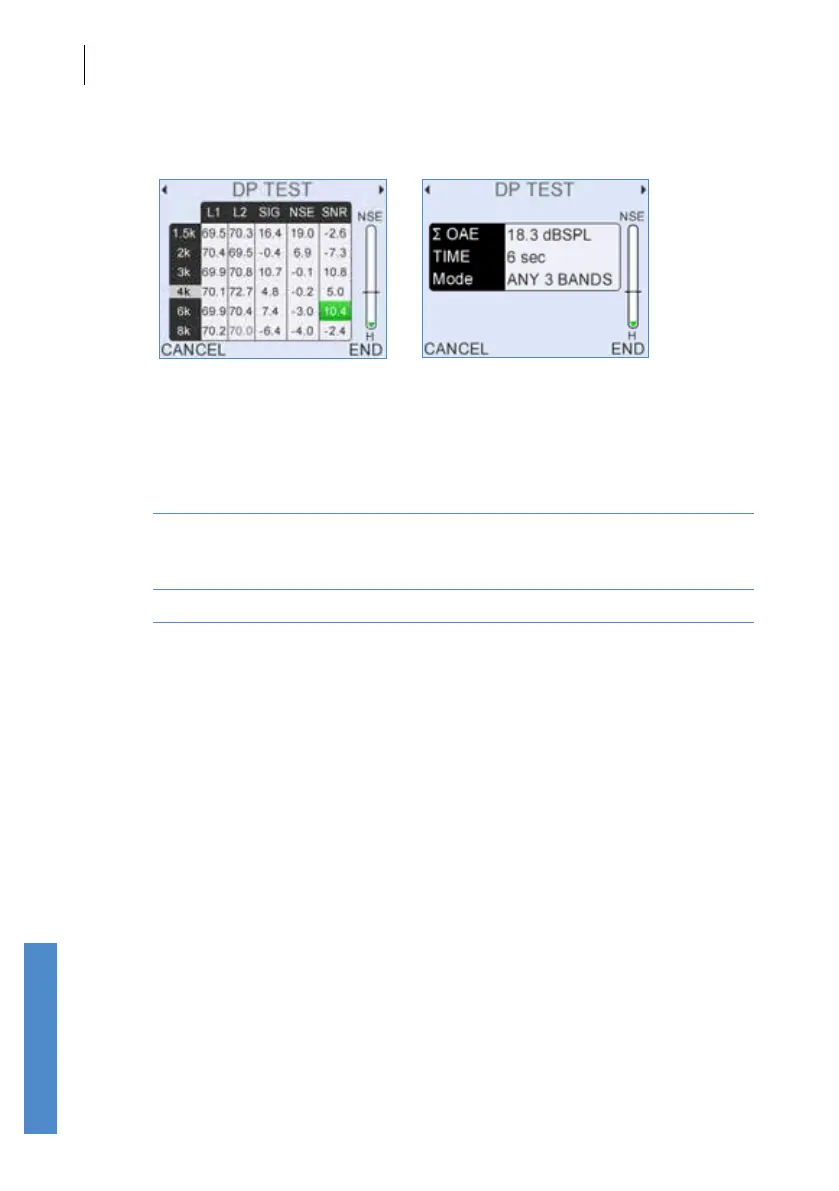
8.2.4 Data tables
During the test the data tables can be accessed by pressing right or left
arrow keys.
Data Table 1 displays the dBSPL levels of:
SIG The signal level recorded at distortion product frequency (2F1-F2)
NSE The average Noise level recorded at the corresponding
DP frequency region (this value depends on the Noise Mode
set - see chapter
15).
SNR The Signal-to-Noise Ratio (SIG minus NSE)
A dash (-) indicates no data has been collected at that frequency.
Data Table 2 displays the current total OAE summed over the test points,
the test duration and the test mode used.
8.2.5 Noise level indicator
A noise level indicator is shown on the right of screen. The bar moves in
response to changes in noise. For good testing conditions the bar should
be consistently below the Noise Reject Level which is represented by the
horizontal line across the noise level indicator. The bar is lled red if the
level is above the threshold and green if it is below. The noise level shown
is calculated from the peak sound level recorded within each response
window.
The letter below the indicator represents the noise reject threshold level.
This can be altered using the up and down arrow keys.
The noise level indicator allows continuous monitoring of the noise level
during a test.