The most recent scan added to the model displays with a color coding to indicate the focal
distance of the data added.
• Green - close to the tip
• Yellow/Orange - middle of the range
• Red - end of the range (far away from tip)
Note: Any color shown means the scanner IS capturing data. The colors only
correspond to the focal distance.
The building model rotates to match the Live View.
Click the button on the scanner to stop scanning.
A raw data model is displayed.
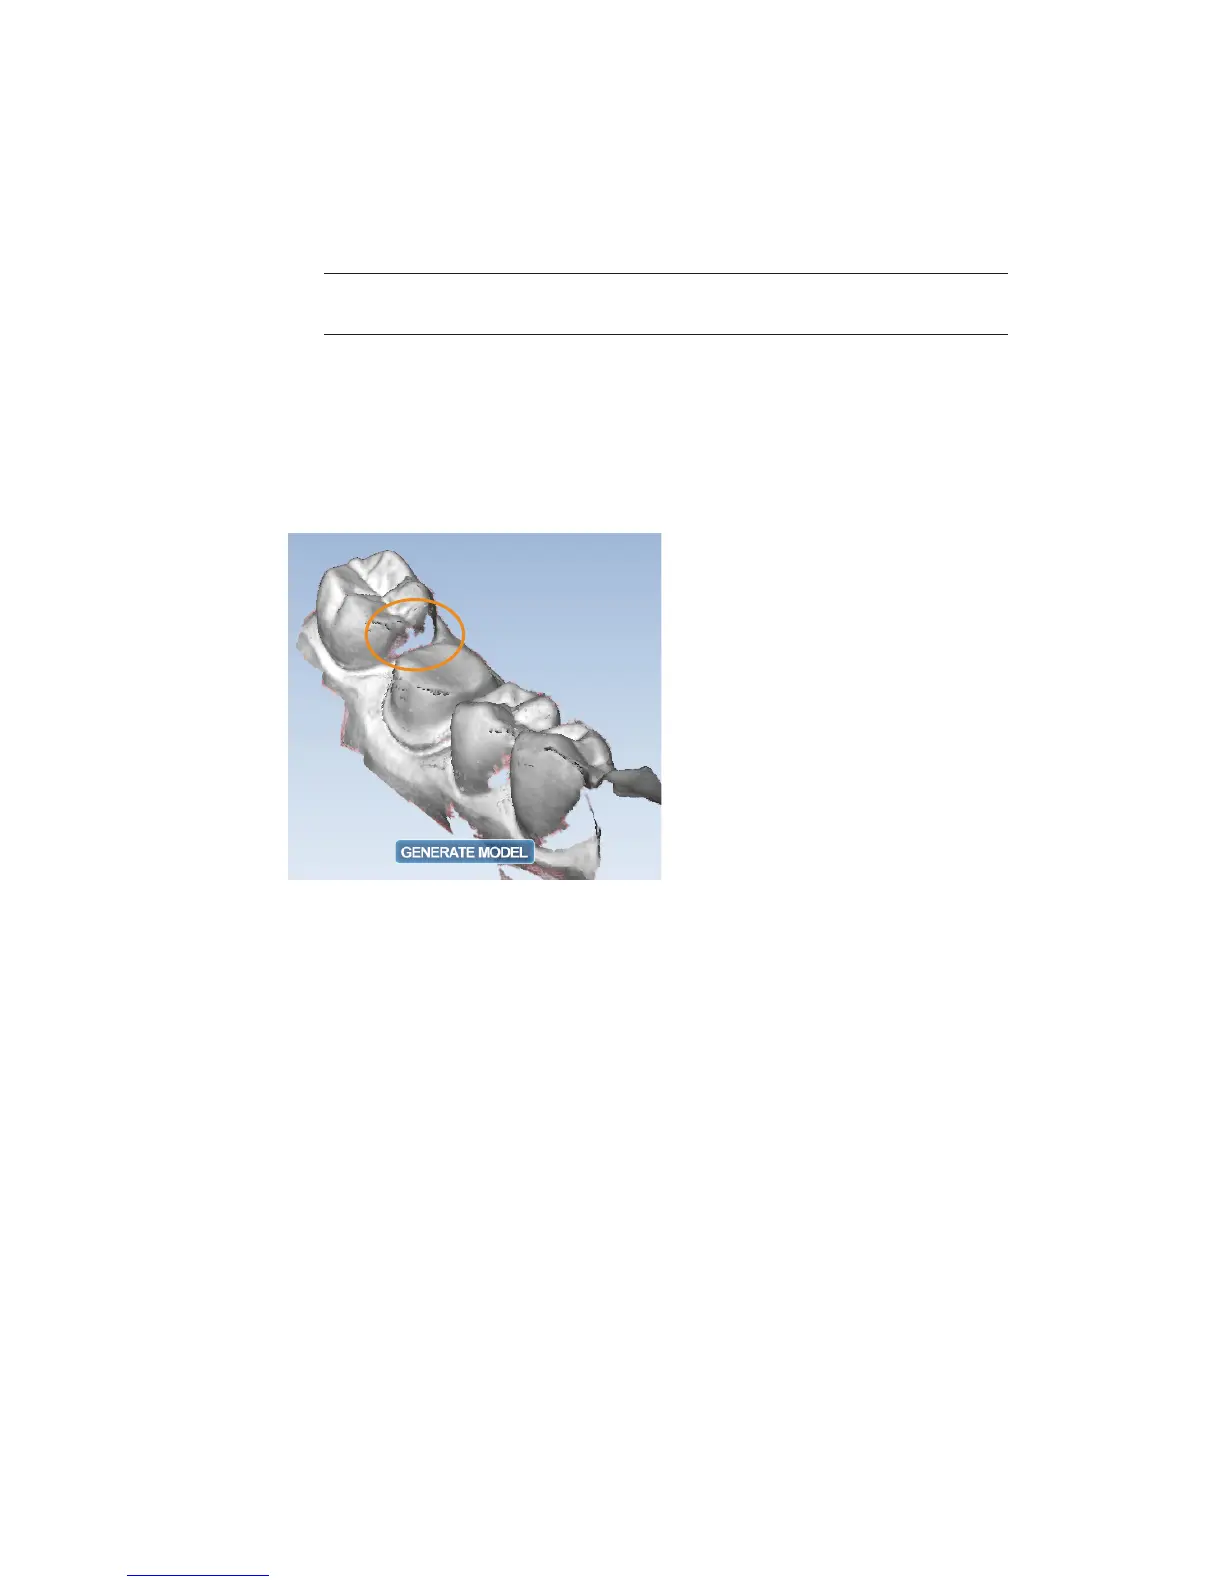
Rotate the model to look for low data areas in key areas: the preparation, interproximal
contacts, etc..
Fill in missing data where needed.
Click Generate Model or press M on the keyboard to create the 3D model. If you exit without
generating the model, the scans will be lost.
Click Data Density View to evaluate the model for low data. See “Checking Your Model For
Missing Data” on page 26 for more information.
For design purposes, you may want to acquire more details of the adjacent teeth. If extra scans
are desired, deactivate Data Density View to speed up the process. Reactivate when nished
scanning.
Scanning Options
Adjust Live View Window Size
While the Live View is active, The window size can be adjusted. By default, the Live View is large
enough to ll the height of the scanning window. To make it smaller, place the mouse cursor on
the left edge of the Live View. Right-click and drag the window to the desired size.
The Live View will return to the default size next time it is activated.
10828200.B Scanning 25