COPYRIGHT © 2015 RED.COM, INC
RED DSMC OPERATION GUIDE: EPIC/SCARLET
955-0020_V6.0, REV-J | 58
HISTOGRAM
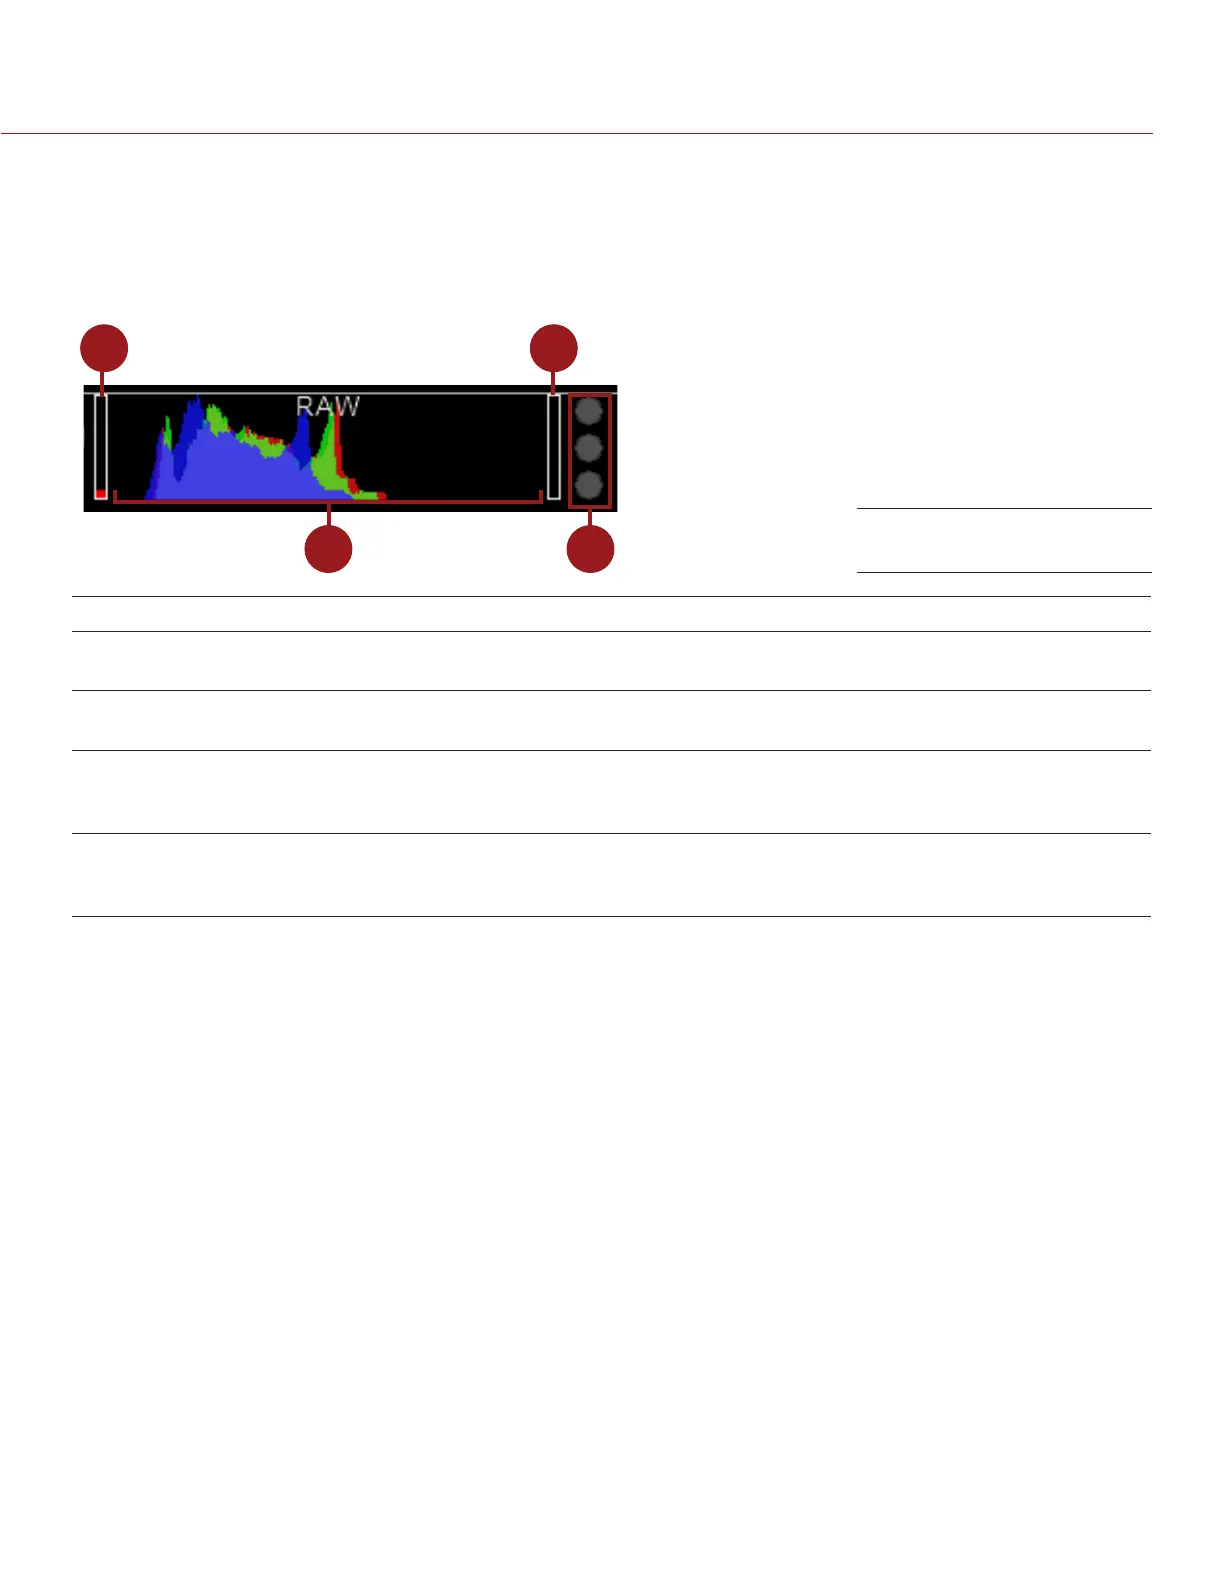
This section describes the elements that comprise the Histogram section in the Lower Status Row. This section
of the GUI helps ensure that recorded footage is properly exposed.
Tap the Histogram in the Lower Status Row to access the Tools menu. For more information, go to “Tools” on
page 69.
1
2
4
3
# ITEM DESCRIPTION
1 RAW Level Bar (left)
1
Also known as a “goal post”. Displays the amount of pixels in the image that
are underexposed (noise)
2 RAW Level Bar (right)
1
Also known as a “goal post”. Displays the amount of pixels in the image that are
overexposed (clipping)
3 RGB Histogram Provides a visual representation of exposure and sensor data levels for Red,
Green, and Blue channels; meter is affected by White Balance, ISO, and VIEW/
LOOK settings
4 RAW Clip Meter Also known as “traffic lights”. Provides a visual representation of exposure and
sensor data levels for Red, Green, and Blue channels; Circles (traffic lights) will
light up when clipping occurs
1. The RAW Level Bars display the amount of pixels in the image that are noisy or clipped in relation to the total number of pixels in the
image. For example, if the left RAW Level Bar is 1/8 of the total height, that means that approximately 1/8 of the total pixels in the total
image are at an exposure level that is at risk of displaying noise when pushed to higher ISO or FLUT
®
values in post production.
SYSTEM STATUS INDICATORS
This section describes the colors and behavior of the System Status indicators in the Lower Status Row. Tap
the System Status indicators in the Lower Status Row to access the System Status menu. For more information,
go to “System Status” on page 121.
CAL: T/E INDICATOR
The CAL: T/E indicator shows changes to temperature (T) or exposure (E) in relation to the active calibration
map. If the temperature or exposure change significantly, black shade the camera at the desired temperature
and exposure. Failure to properly calibrate the sensor may reduce image quality.
Green: Sensor temperature or exposure are properly calibrated for current settings.
Yellow: Slight change in sensor temperature or exposure.
Red: Significant change in sensor temperature or exposure.
The – and + indicate whether the sensor temperature or exposure has decreased or increased, respectively.
NOTE: T and E indicators change colors independently of each other.
Histogram (Exposure)