Chapter 8. Matrix Counting and Analysis Workflow
8004708 Cellometer™ Ascend User Manual Rev A 37
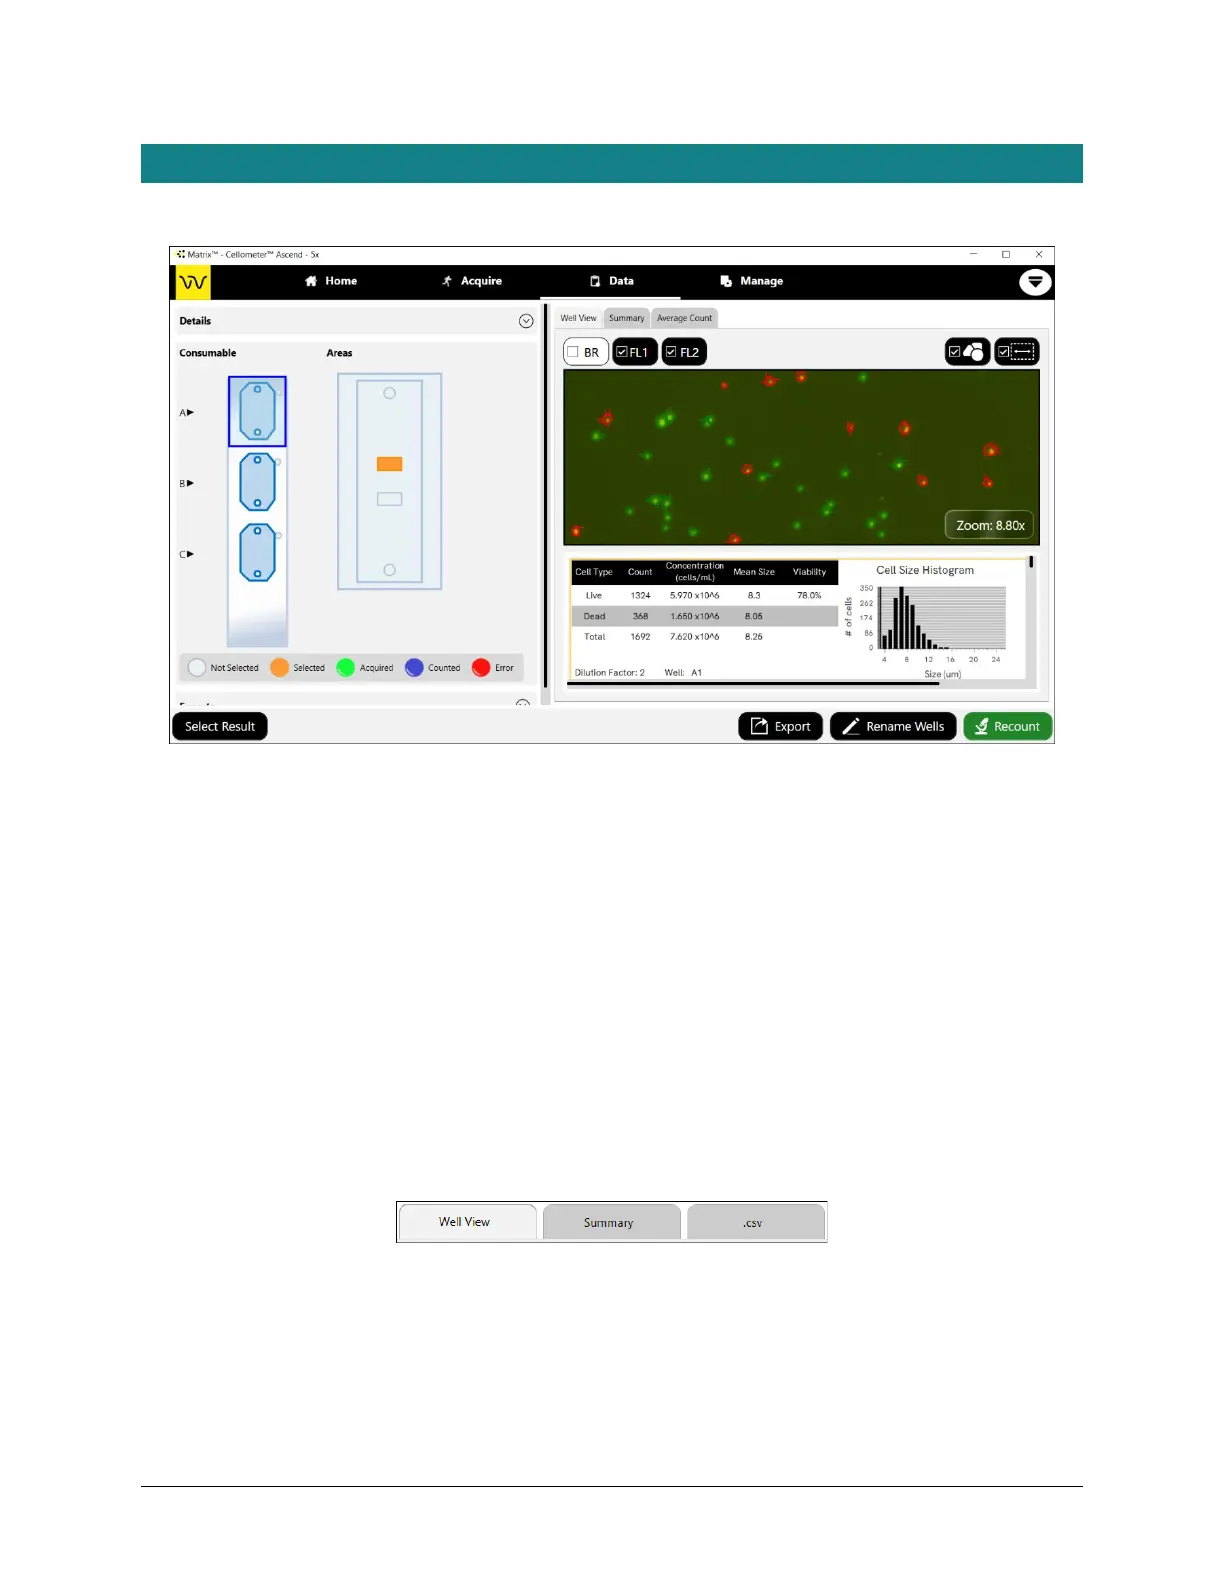
ANALYZING SCAN RESULTS
When analyzing scan results, an image is displayed in the viewing pane for a specific counting chamber and area.
To vary the image displayed, users can tap different chambers (in the Consumable area) and different areas (in the
slide visualization), or tap inside the viewing pane to drag and drop the image. Users can also pinch to zoom the
image (i.e., touching the center of the image with two fingers and slowly spreading them apart to zoom in and then
reversing this action to zoom out).
The Images Per Well value (e.g., 2, 4 or 8) defined in parameter settings determines the number of independent
images of a slide chamber/well available for viewing and export, rather than one large image of the whole chamber,
significantly reducing image load time and improving memory handling. During export, the software appends a
“WellNumber_N” indicator (e.g., A1_1, A1_2, A1_3, A1_4) to each filename indicating its position index for the area
in the chamber/well.
Understanding Default Report Tabs
Report tabs initially displayed across the top of the viewing pane are associated with report templates that have
been assigned to the current assay and are enabled by default to format the presentation of scan result data.
Although the Well View tab will always be enabled, you can change the report template used for its display. In
addition, you can disable default report tabs, change current report template assignments and add new tabs to
meet your reporting needs. See the Cellometer Matrix Software User Manual for custom reporting details.