Chapter 8. Matrix Counting and Analysis Workflow
8004708 Cellometer™ Ascend User Manual Rev A 38
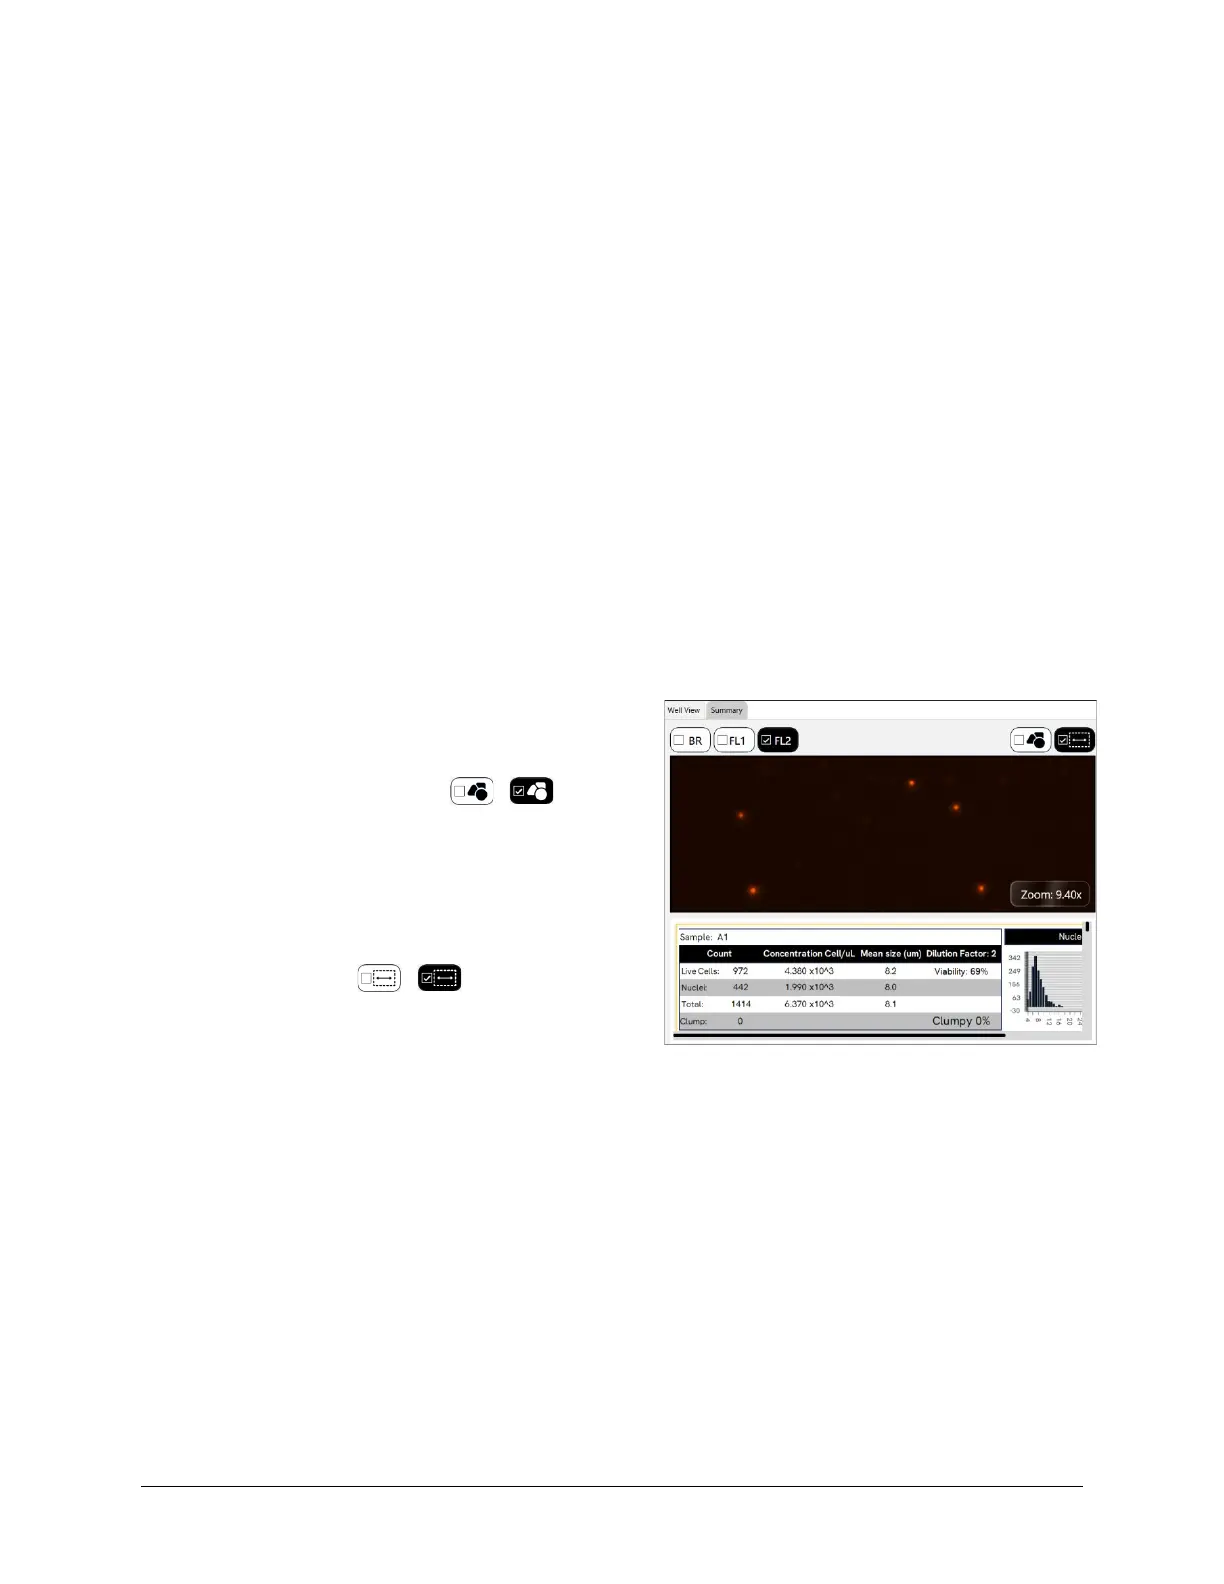
Changing Well View Image Display
The Well View tab will always be displayed in the Results screen and includes both an image and the associated
count results for the selected “well” or chamber. If multiple images were taken (based on your Images Per Well
selection), they will each represent a separate area in the chamber (e.g., 4 Images Per Well will result in an image
of each quadrant). Tap and drag the image to view other locations (or areas) in the chamber. To display images for
other acquired samples, select other highlighted areas in the Well Map.
To zoom in/out of the image, move mouse to hover cursor over the viewing pane and turn the scroll wheel or, if
using a touchscreen, by applying universal gestures (e.g., touching the center of the image with two fingers and
then slowly spreading them apart to zoom in and reverse this action to zoom out). If Zoom button is enabled,
Zoom magnification is displayed in bottom right corner of the viewing pane and can be increased up to 10.00x.
At the bottom of the Well View tab is a report containing “well-“ or chamber-level details for the sample. If an
Images Per Well value was selected, the report represents consolidated data from all images.
Varying Well View Channels/Counted Overlay Display
In the Well View report tab displayed by default, the following buttons may be available across the top of the
viewing pane based on the Imaging Mode defined in the current assay.
• Tap the Brightfield (BR) or Fluorescence (e.g., FL1 or FL2)
buttons to select/de-select channels used in the image
display. Channel views are overlaid on top of each other.
• Tap the Counted Overlay button / to
show/hide the graphic overlay that identifies Counted
cells by surrounding them with color-coded outlines. For
2-channel Viability assays, Green is used for counted/live
cells, Red for dead cells and Yellow for cells not counted
(e.g., if larger than the specified cell diameter).
• Tap the Zoom button / to enable/disable
display of current Zoom magnification in bottom right
corner of viewing pane. Zoom feature
will still be functional even if not displayed.
Understanding Custom Reporting
The Matrix custom reporting feature allows you to assign and/or modify report templates to be used by assays
when generating scan results. You can change the report template used for display of the Well View report (which
is always displayed) and add report templates to be enabled as tabs or output as specific file types (e.g., CSV, Excel,
PDF and Word) that can be opened/printed upon report generation.
Note: Any changes made to Reporting options for an assay will be saved with the assay and applied to all other
scan results using that assay the next time a recount is performed.