60
Measurement in FFT Mode
X axis zoom factor
Shows the X axis zoom factor for the currently displayed graph. The
following settings are available.
• Number of analysis lines is 3200: ×1, ×2, ×4, ×8, ×16
• Number of analysis lines is 1600: ×1, ×2, ×4, ×8
• Number of analysis lines is 800: ×1, ×2, ×4
• Number of analysis lines is 400: ×1, ×2
• Number of analysis lines is 200: ×1
X axis unit
Shows the unit selected with [X Unit] in the [Display] menu.
• Hz: Hertz
• kcpm: Kilo Cycles per Minute
• odr: order (Reference frequency set. For setting procedure, see
page 68.)
X axis upper limit
Shows the upper limit value of the X axis for the current display range.
Overall value
Shows the total spectrum power (excluding DC components).
Overlay symbol
This appears if overlay display (see page 110) has been selected.
Magnifying glass symbol
This appears in display scaling mode. The SCALE ON/OFF key is used
to switch the mode on and off. For details, see pages 69 to 70.
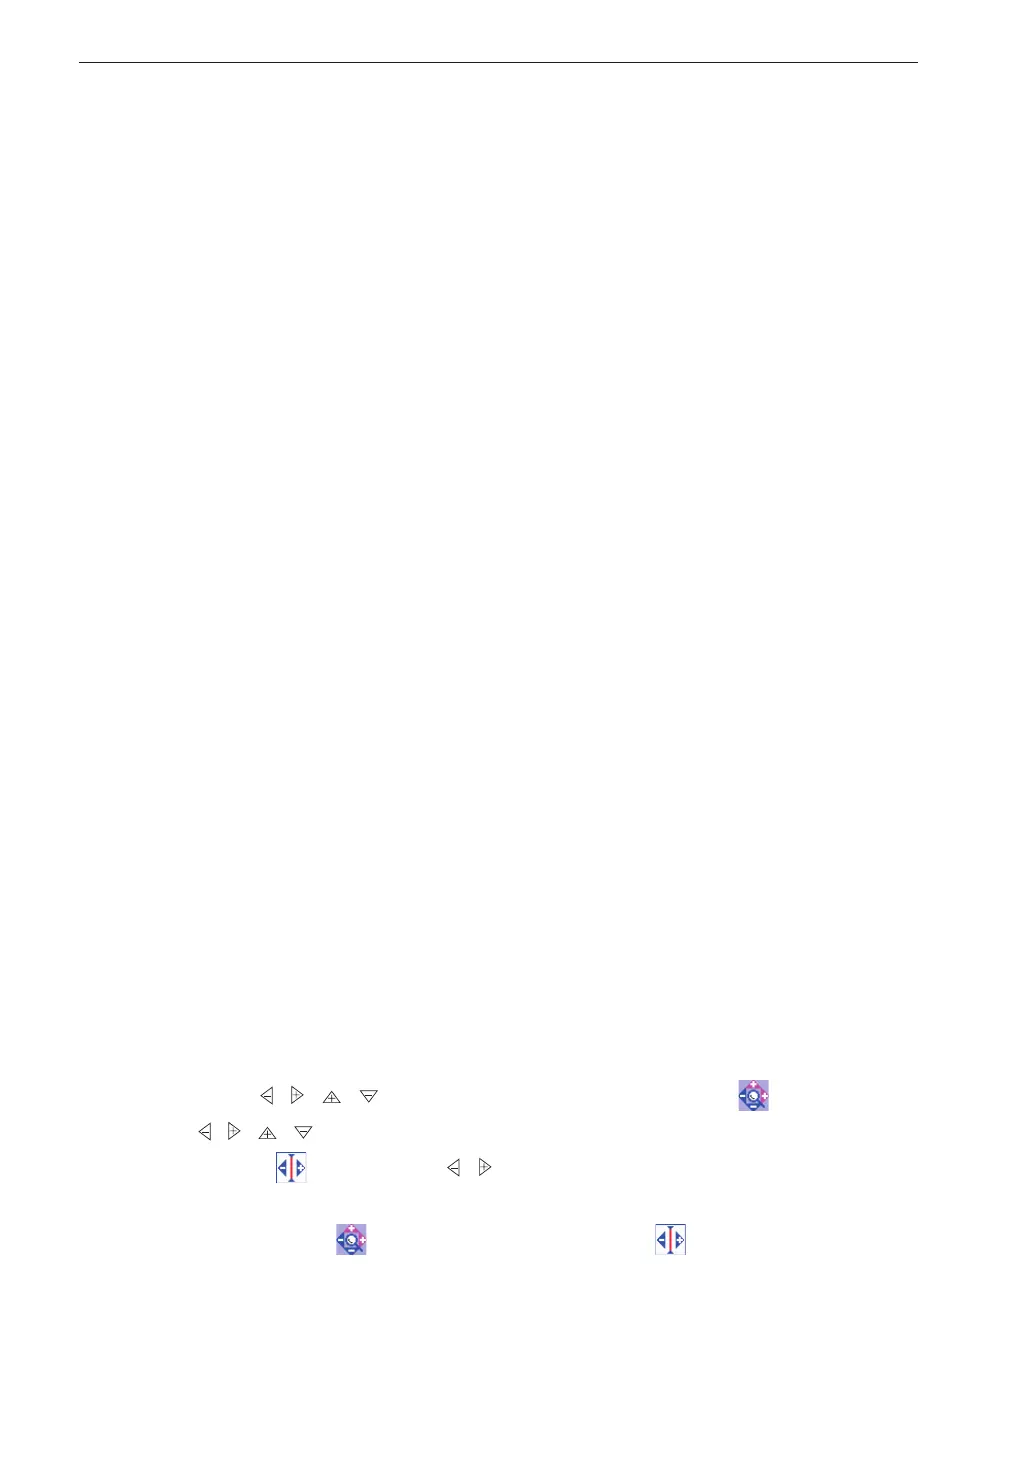
Graph zoom symbol or cursor move symbol
These appear in display scaling mode (see page 69) and show the function
of the / / / keys. When the graph zoom symbol is shown, the
/ / / keys serve to change the zoom factor. When the cursor move
symbol is shown, the / keys serve to move the cursor.
The SCALE EXPAND/MOVE key is used to switch between the graph
zoom symbol and the cursor move symbol .
 Loading...