A4US
US
A4
US A4
US
A4
A4 US
US
A4
US
A4
A4 US
IQ3 Full Configuration Manual – Section: Data Log 53
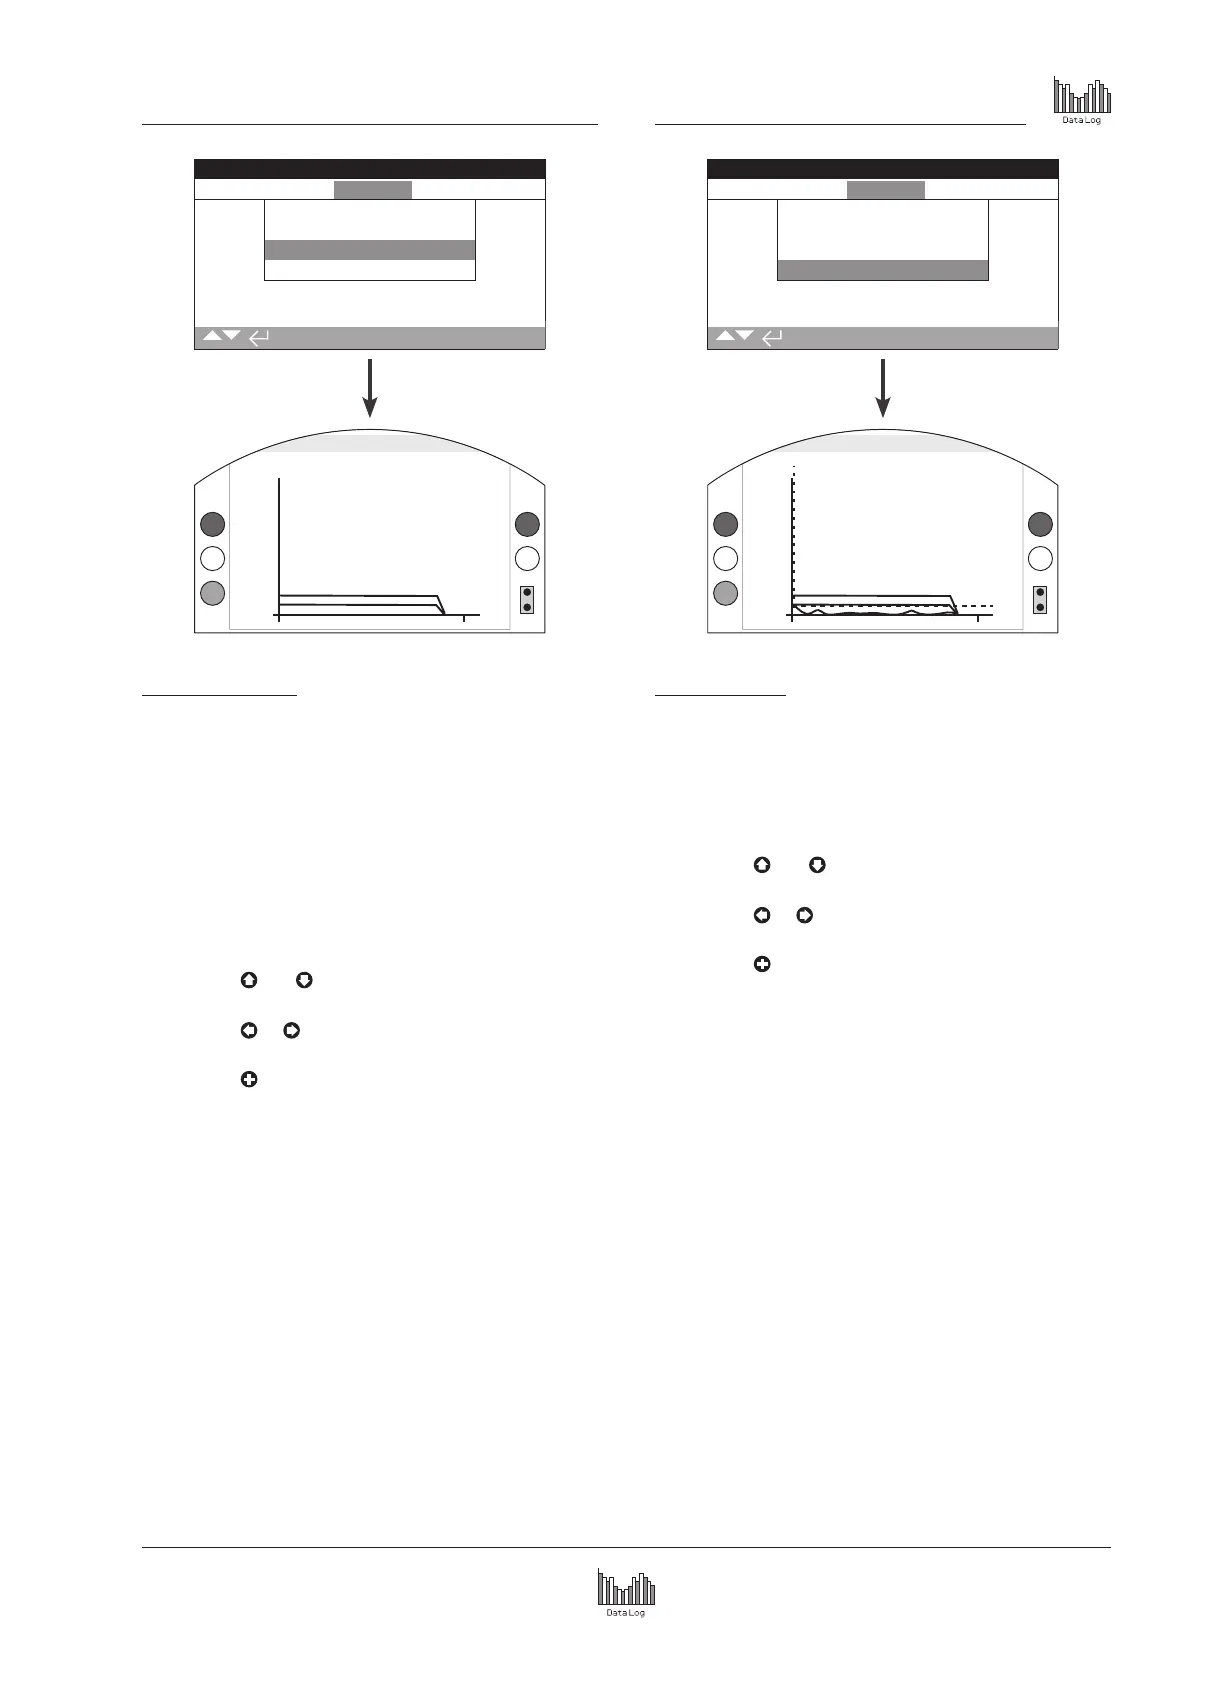
4.3.3 Trend Logs
–
Vibration Average
Open Limit
Trend Logs
Temperature
Battery
Vibration Average
Vibration Peak
Vibration Average
X Axis Hr:0 mG:0
8000
mG
0
4Hours
Vibration Average
This screen displays average vibration levels (in mG) over the
last 24 hours/30 days/12 months/10 years. The sensor is located
on the circuit board and can detect vibration (forces) in three
axes. In normal mounting position (handwheel pointing up) you
could expect to see around 980 mG constantly acting in the Y
axis. With other mounting orientations, the forces measured
(nominally) will be different*. Vibration analysis graphs may help
the user understand how plant induced vibration affects actuator
/ valve operation.
* The average vibration graph is intended to measure the vibrational
forces over time in order to assist in identifying problematic vibration and
is not intended for accurate vibration analysis.
Pressing the
and arrows cycles through the X, Y and
Z axis.
Pressing the
or arrows moves the cursor along the
graph by 1 hour/1 day/1 month/1 year increments.
Pressing the key cycles through the timescales of 24
hours/30 days/12 months/10 years.
4.3.4 Trend Logs
–
Vibration Peak
Open Limit
Trend Logs
Temperature
Battery
Vibration Average
Vibration Peak
Vibration Peak
Peak X Hr:0 mG:400
8000
mG
0
4Hours
Peak Vibration
This screen displays peak vibration levels over the last 24
hours/30 days/12 months/10 years. The levels shown will be the
highest recorded for that period*.
* The peak vibration graph is intended to measure the highest vibrational
forces over time in order to assist in identifying problematic vibration and
is not intended for accurate vibration analysis.
Pressing the
and arrows cycles through the X, Y and
Z axis.
Pressing the
or arrows moves the cursor along the
graph by 1 hour/1 day/1 month/1 year increments.
Pressing the key cycles through the timescales of 24
hours/30 days/12 months/10 years.