Internal UV Ozone Photometer Page 9-
Sample Flow This is the flow through the Photometer
as measured by the Photometer's flow
sensor.
Solenoid Valves The states of the reference and sample
solenoid valves and the pump are
indicated here. An "X" indicates that
the valve or pump is active.
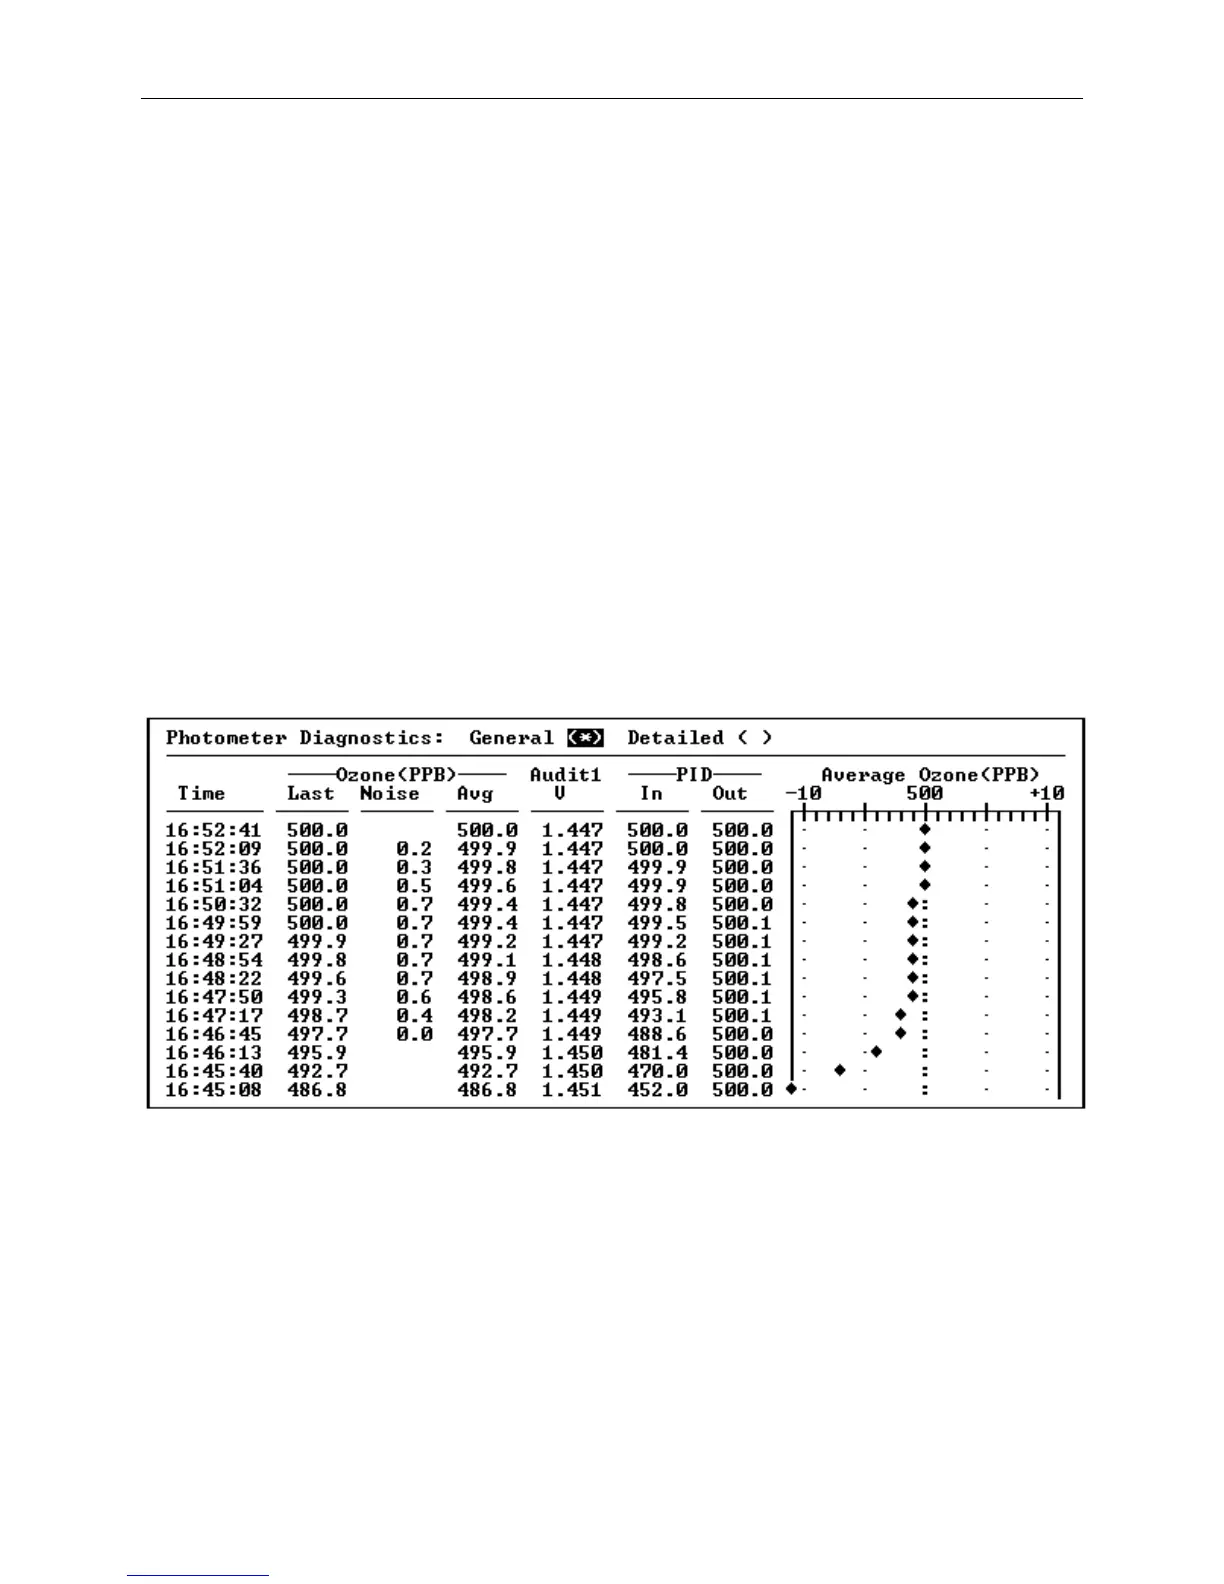
Another valuable source of information about the current status
of the 2010D's Photometer is the Photometer Diagnostics screen,
which may be selected from the "Diag" menu. Figure 9- shows the
"General" Photometer Diagnostics screen, which presents status
information about the last fifteen Photometer cycles in a tabular
format, with the most recent value on top. Each time the
Photometer completes a cycle, the data will scroll down to make
room for the new data.
Figure 9-4 The Photometer Diagnostics Screen, General
On the right side of the General Photometer Diagnostics screen is
a simulated strip chart that presents the latest average ozone
measurements taken from the Photometer. The strip chart always
presents a 20 PPB range centered around the currently desired
ozone setpoint, allowing the deviation from the desired ozone
concentration to be observed in a graphical format. This chart
is particularly useful for observing the ozone response when the
ozone servo control is active.
 Loading...