115
Chapter 4: Graphing Features
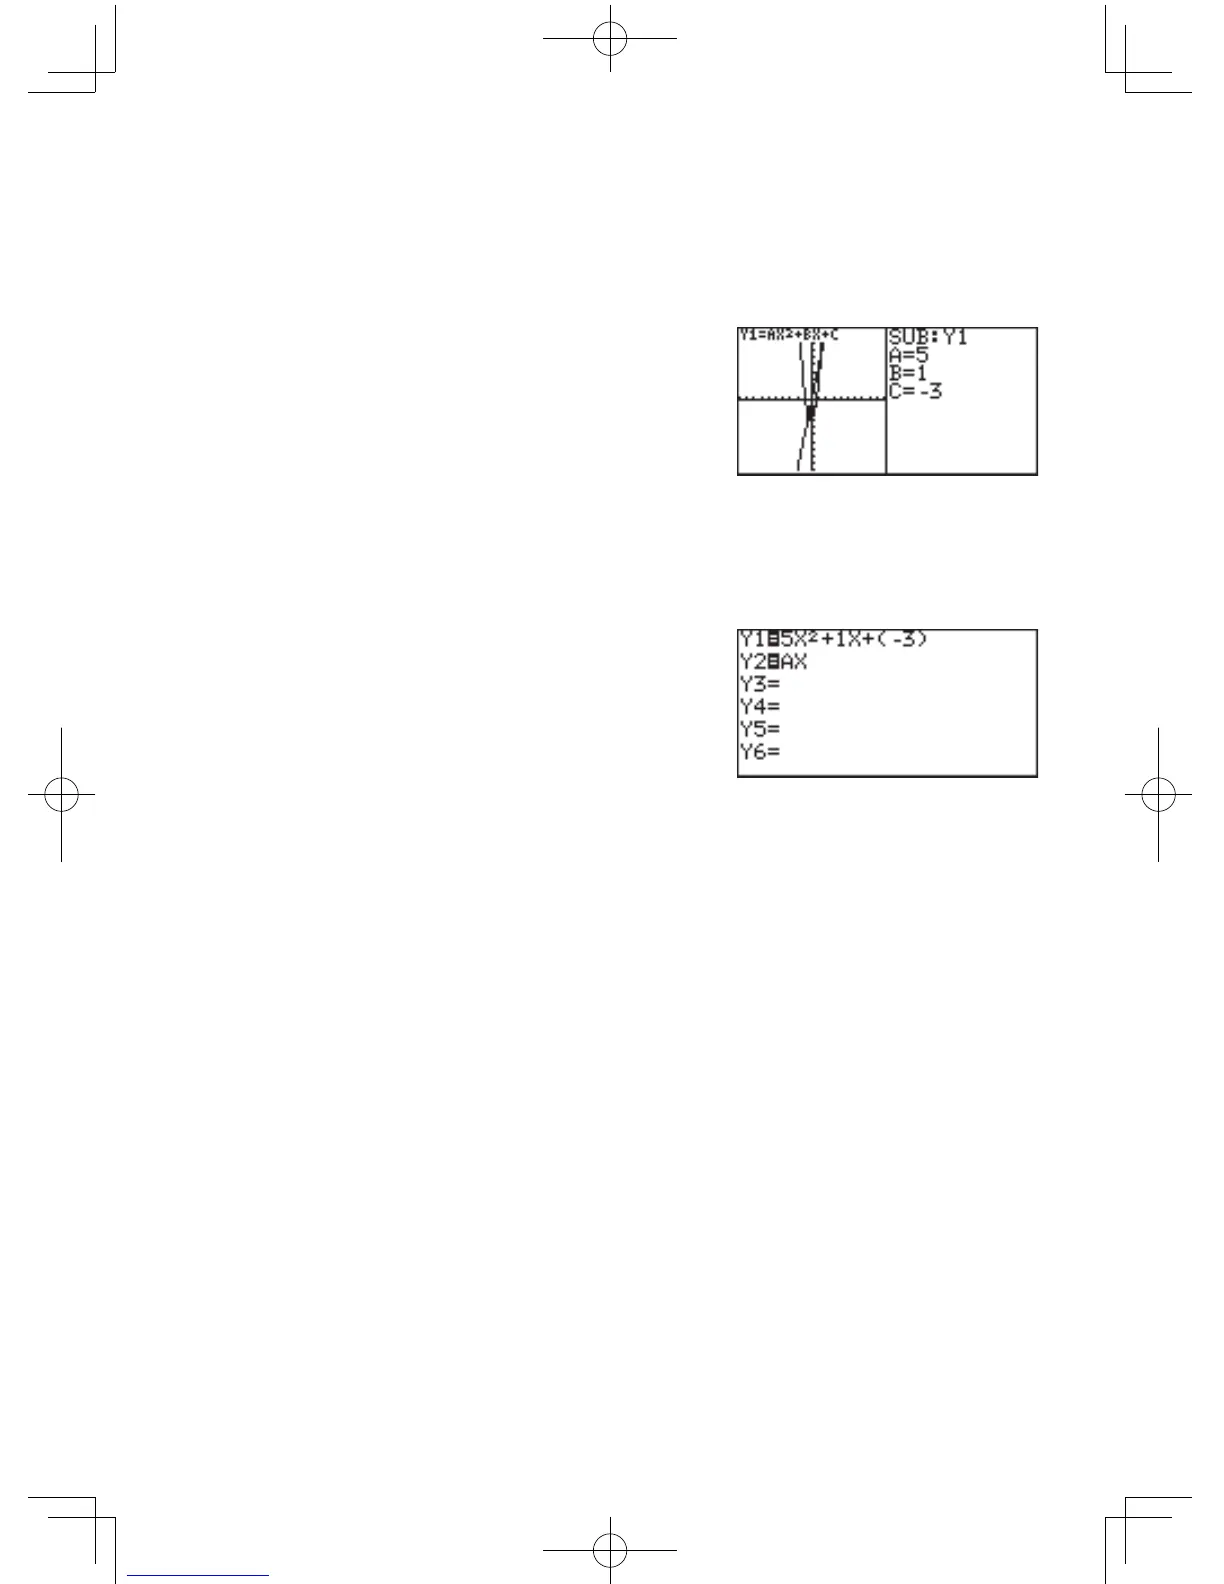
Next,changevariableAfrom2to5andseehowthegraph
changes.
Rewritetheequationbasedonthenumericvaluesinputonthe
substitution feature screen.
1. Press
{
{
5
E
.
(ThecursorismovedfromC
toAand5isinput.)
The slope of the graph
becomes sharp.
* Move the cursor accordingly and substitute other numeric
values for variables to view how the graph changes.
* The trace function cannot be used in the substitution feature.
(When
U
ispressed,thefull-screengraphwillappear.)
2. Press
@
h
to return
to the equation display
screen.
The equation is written based
on the last numeric values
input on the substitution
feature screen.
* Once
@
h
have been pressed, the screen cannot be
returned to the previous substitution feature screen.