80
Chapter 4: Graphing Features
5. Graphing Parametric Equations
Atwo-dimensionalparametricequationassumesthatbothXandYarerepresented
by functions in a third variable T. When set in parametric graphing mode, the calculator
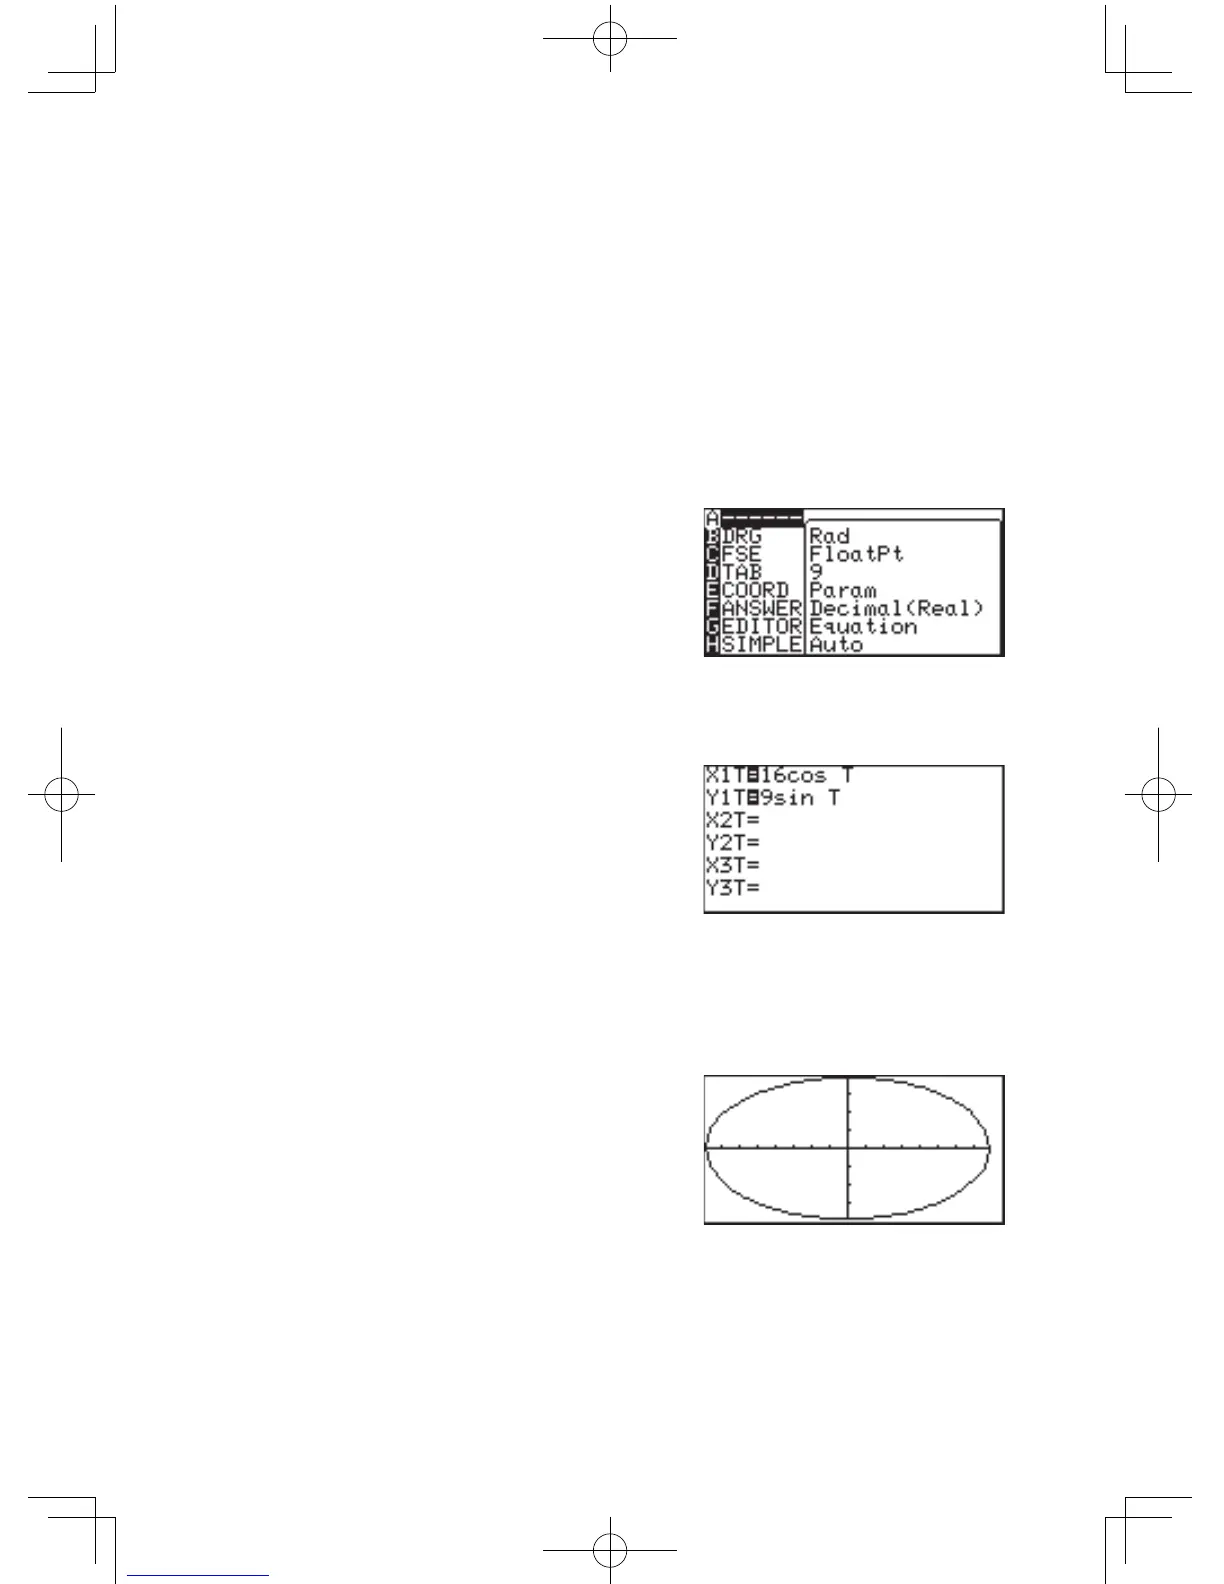
automaticallysetsuptheGraphEquationEntryscreentotakeonesetofXandYper
eachgraph,withtheequation’srightsidevariabletobesetas“T”.
Example
• Drawagraph:
x(t) = 16cos(t), y(t) = 9sin(t)
.
1. Press
@
;
toentertheSETUPmenu.
2. Press
E
to select E
COORD, then
2
to
select 2 Param.
Be sure that the other
settings are as shown on the
right.
ToexittheSETUPmenu,press
C
.
3. Press
Y
togototheGraphEquationEntrywindow.
4. Enter
16cos(t)
for X1T=.
Press
E
when done
entering.
5. Enter
9sin(t)
for Y1T=.Press
E
when done entering.
Note: Therightsidevariableisautomaticallysetto“T”.Whenthe
X
keyispressedwithintheGraphEquationEntrywindow,itwillenter
thevariable“T”.
6. Press
G
to draw the graph.
7. If the graph line extends
beyond the screen, press
Z
and select A ZOOM
then 1 AUTO.
Use 3 IN or 4 OUT of the A
ZOOMtoadjustthedrawingsize.
YoucanalsosetthedrawingsizeintheWINDOWmenuby
determiningthemaximumandminimumvaluesofT,XandY.