93
Chapter 4: Graphing Features
11. Tables
The calculator enables you to illustrate the changes using the equation and graph you
haveinput.ItalsohastablesforshowingalistofXandYvalues.Eachcolumnitemcan
displayupto7digits,includingasignand/oradecimalpoint.
There are four kinds of tables available corresponding to the coordinate system.
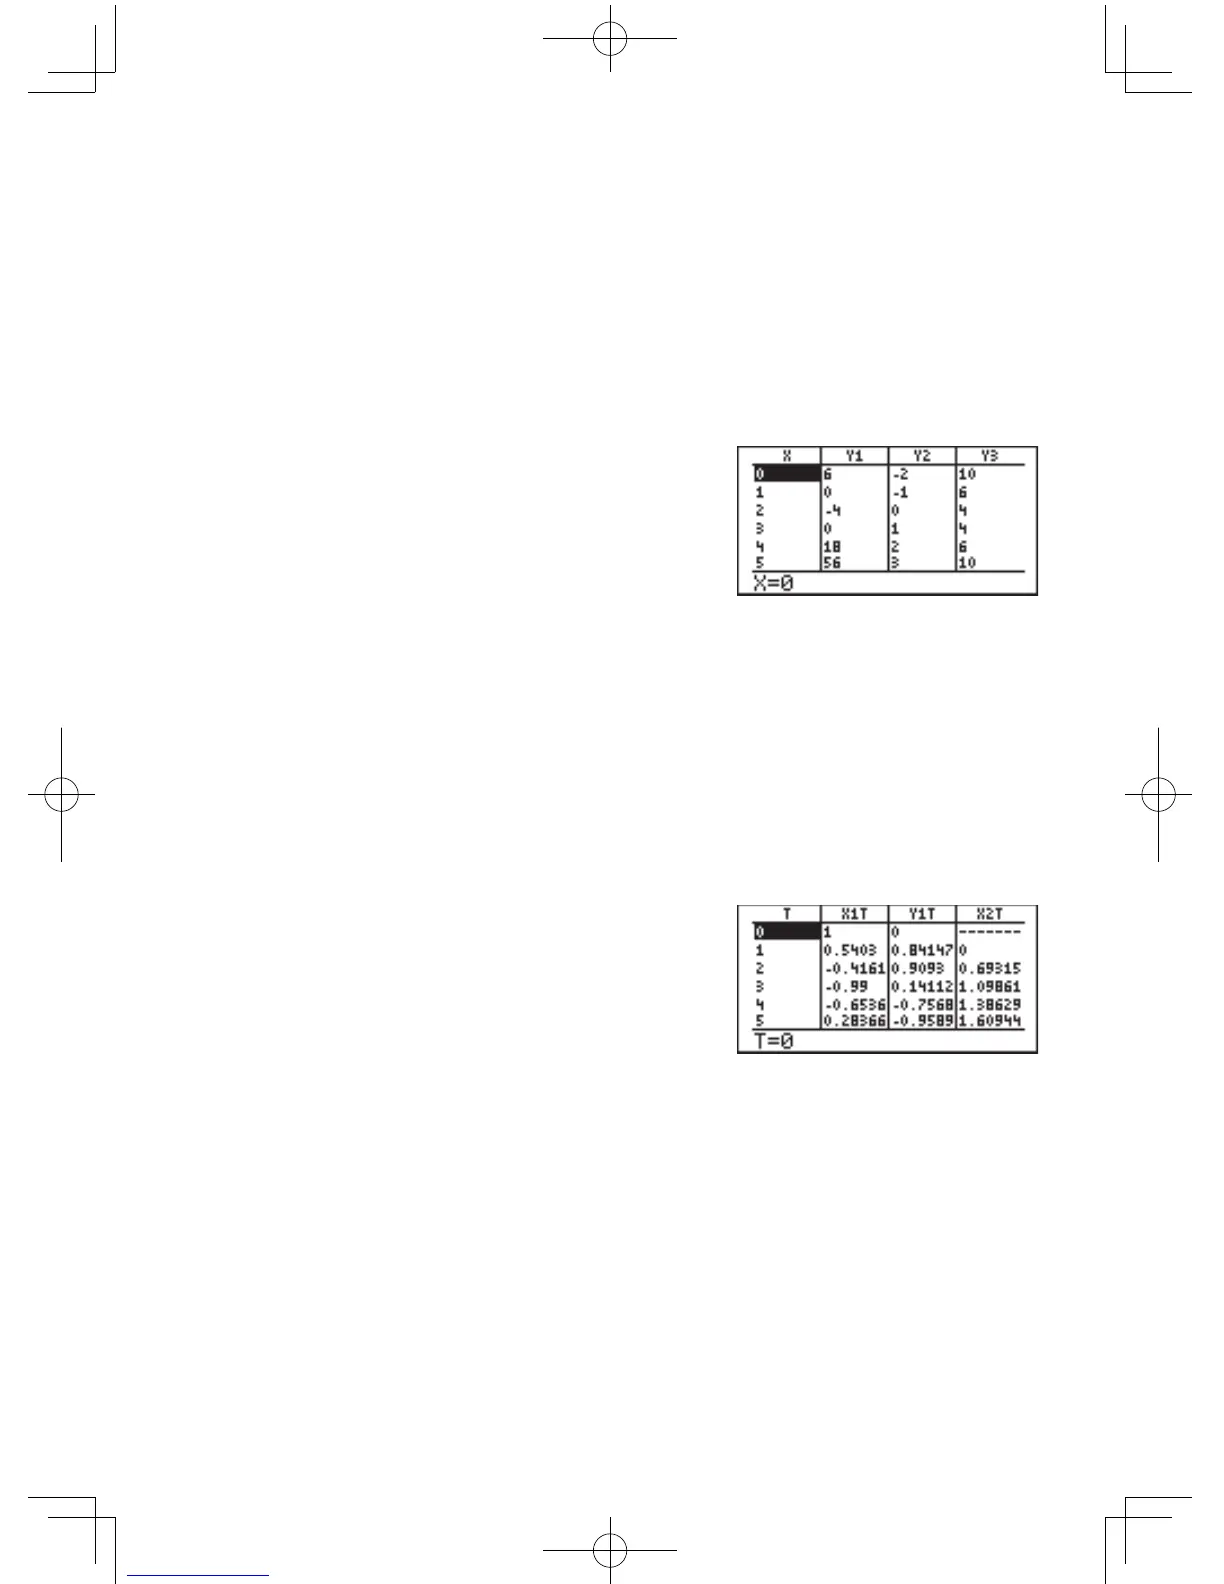
Rectangular coordinate system
• ThevariableXisdisplayedin
the left end column.
• ThecolumnsY1toY3are
displayed on the first screen.
• Press
;
'
to
horizontallyscrollthetable.(ThevariableXisalwaysdisplayedin
the left end column.)
• The10-digitvalueinthecolumnwherethecursoriscurrently
located is displayed on the bottom line of the screen.
• Movethecursorusing
;
'
{
}
.
• Non-inputequationnumbersandequationsinvalidforgraphing
will not be displayed in the above table.
Parametric coordinate system
• ThevariableTisdisplayedin
the left end column.
• ThecolumnsX1T,Y1T,and
X2Taredisplayedontherst
screen.
• Press
;
'
tohorizontallyscrollthetable.
• The10-digitvalueinthecolumnwherethecursoriscurrently
located is displayed on the bottom line of the screen.
• Movethecursorusing
;
'
{
}
.
• Non-inputequationnumbersandequationsinvalidforgraphing
will not be displayed in the above table.