217
Chapter 11: Programming Features
VARS menu
• Functionsthatcontrolthe
graph screen can be selected
fromtheVARSmenu.
• Press
@
z
to display
theVARSmenu(showntothe
right).
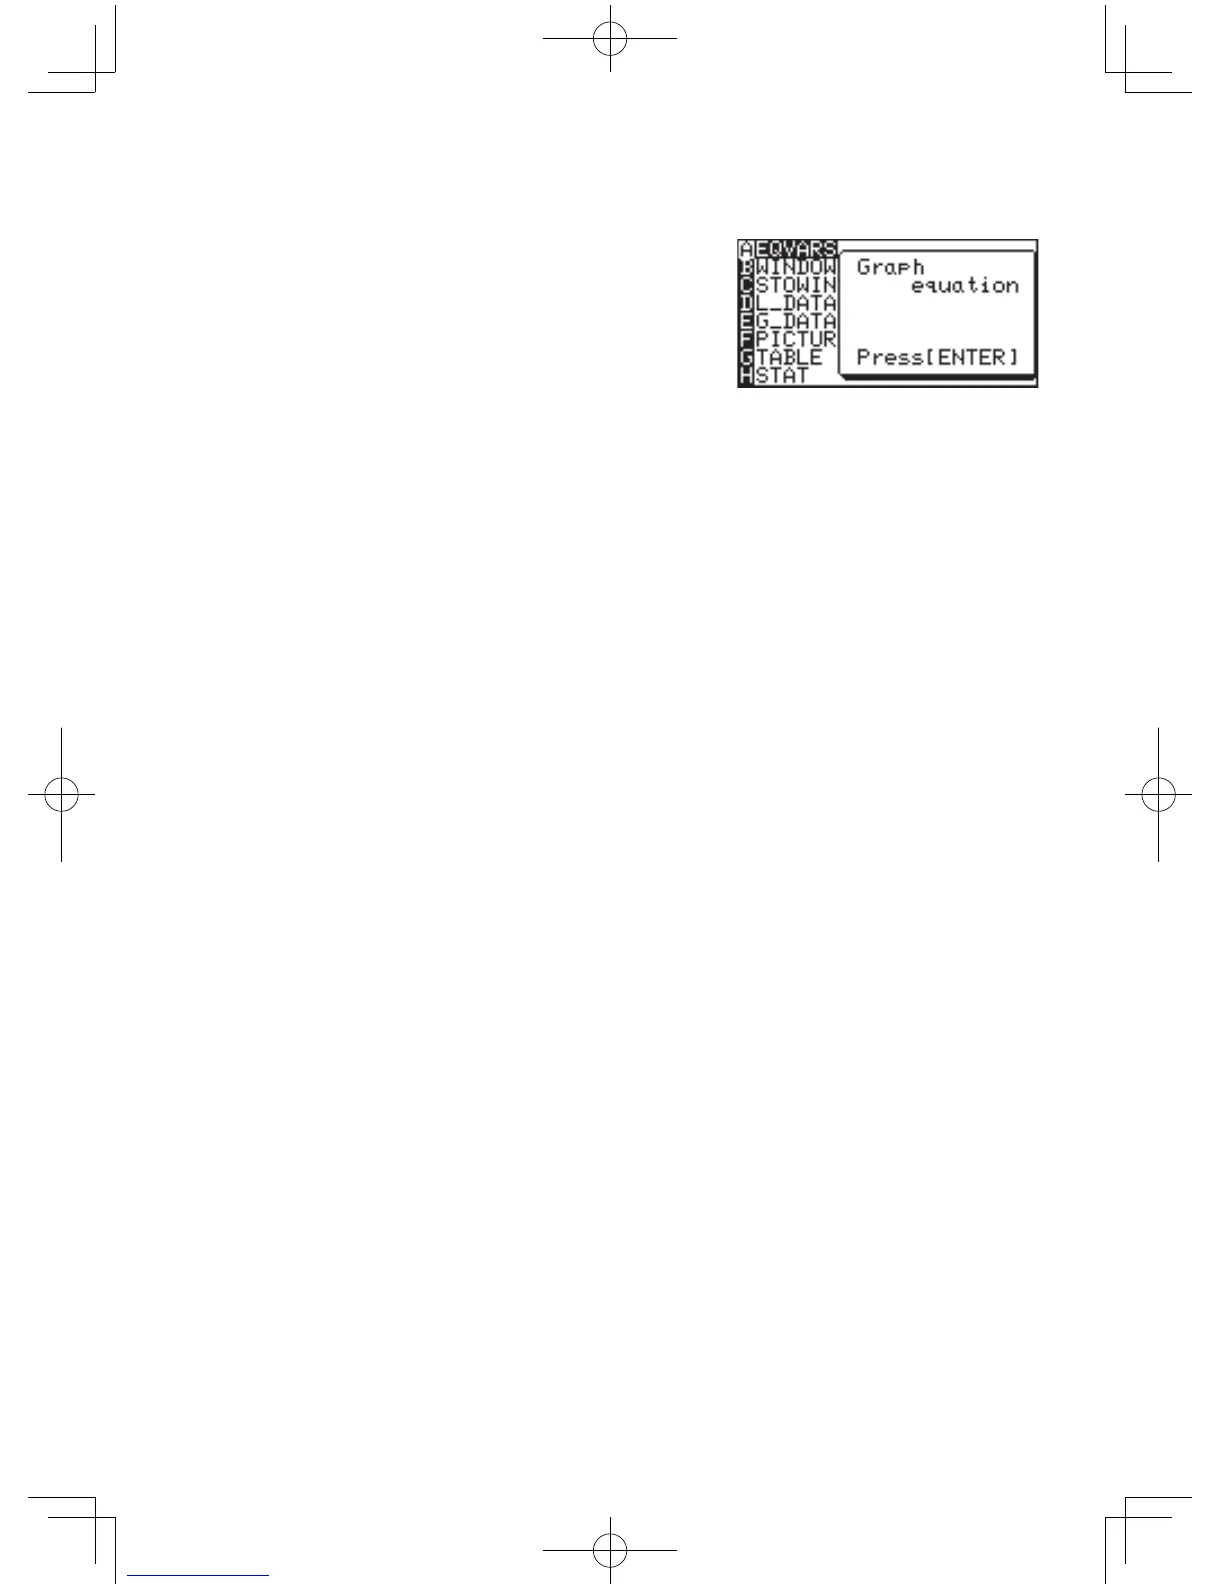
A EQVARS Speciesthegraphequation(Y1toY9,andY0,X1T•Y1Tto
X6T•Y6T,R1toR6).
B WINDOW Speciesthefunctionsthatsetthegraphdisplayscreensize(Xmin,
Ymax,Tstep,etc.).
C STOWIN Speciesthestoredzoom(window)settingvalue(Zm_Xmin,Zm_
Ymax,etc.).
D L_DATA Specieslistdata(L_Data1toL_Data9,andL_Data0).
E G_DATA Speciesthegraphdata(G_Data1toG_Data9,andG_Data0).
F PICTUR Speciespicturedata(Pict1toPict9,andPict0).
G TABLE Speciestablesettingvalues(TableStart,TableStep,TableList).
H STAT Speciesstatistics,functions(x
_
,
Σ
x, y
_
… ), regression expressions,
points and statistical verification functions.
• ThecommandsandfunctionsintheVARSmenucanbe
displayedonthescreen.Currentsettingdatacanalsobereset.
• Theresultsofarithmeticfunctionscanalsobedisplayed.
• TheZOOMcommandisselecteddirectlyfromtheZOOMmenu.
NamesofsomeZOOMcommandschangewheninsertedinto
programs.Theseare[AZOOM],[CPOWER],[DEXP],[ETRIG],
and[FHYP]oftheZOOMmenu.
“Zm_”isautomaticallyaddedtoeachofthesefunctionswhen
inserted into programs.
Example
Zm_Auto,Zm_x
2
,Zm_sin,etc.