68
Chapter 4
Graphing Features
1. Try it!
Two math expressions can be derived from the above fare systems.
If “
y
”representsthecost,while“
x
”representsthemileage,then:
y = 2 + 1.8x
................... TomatoCab’sfaresystem
y = 3.5 + 1.2x
................ OrangeCab’sfaresystem
Usethecalculator’sgraphingcapabilitiestogureoutthe
approximatepointwheretheOrangeCabgetsaheadofthe
TomatoCab,intermsofcostperformance.
CONCEPT
1. By using two linear graphs, the approximate crossing point can
be found.
2. TheexactcrossingpointcanbefoundwiththeTABLEfunction.
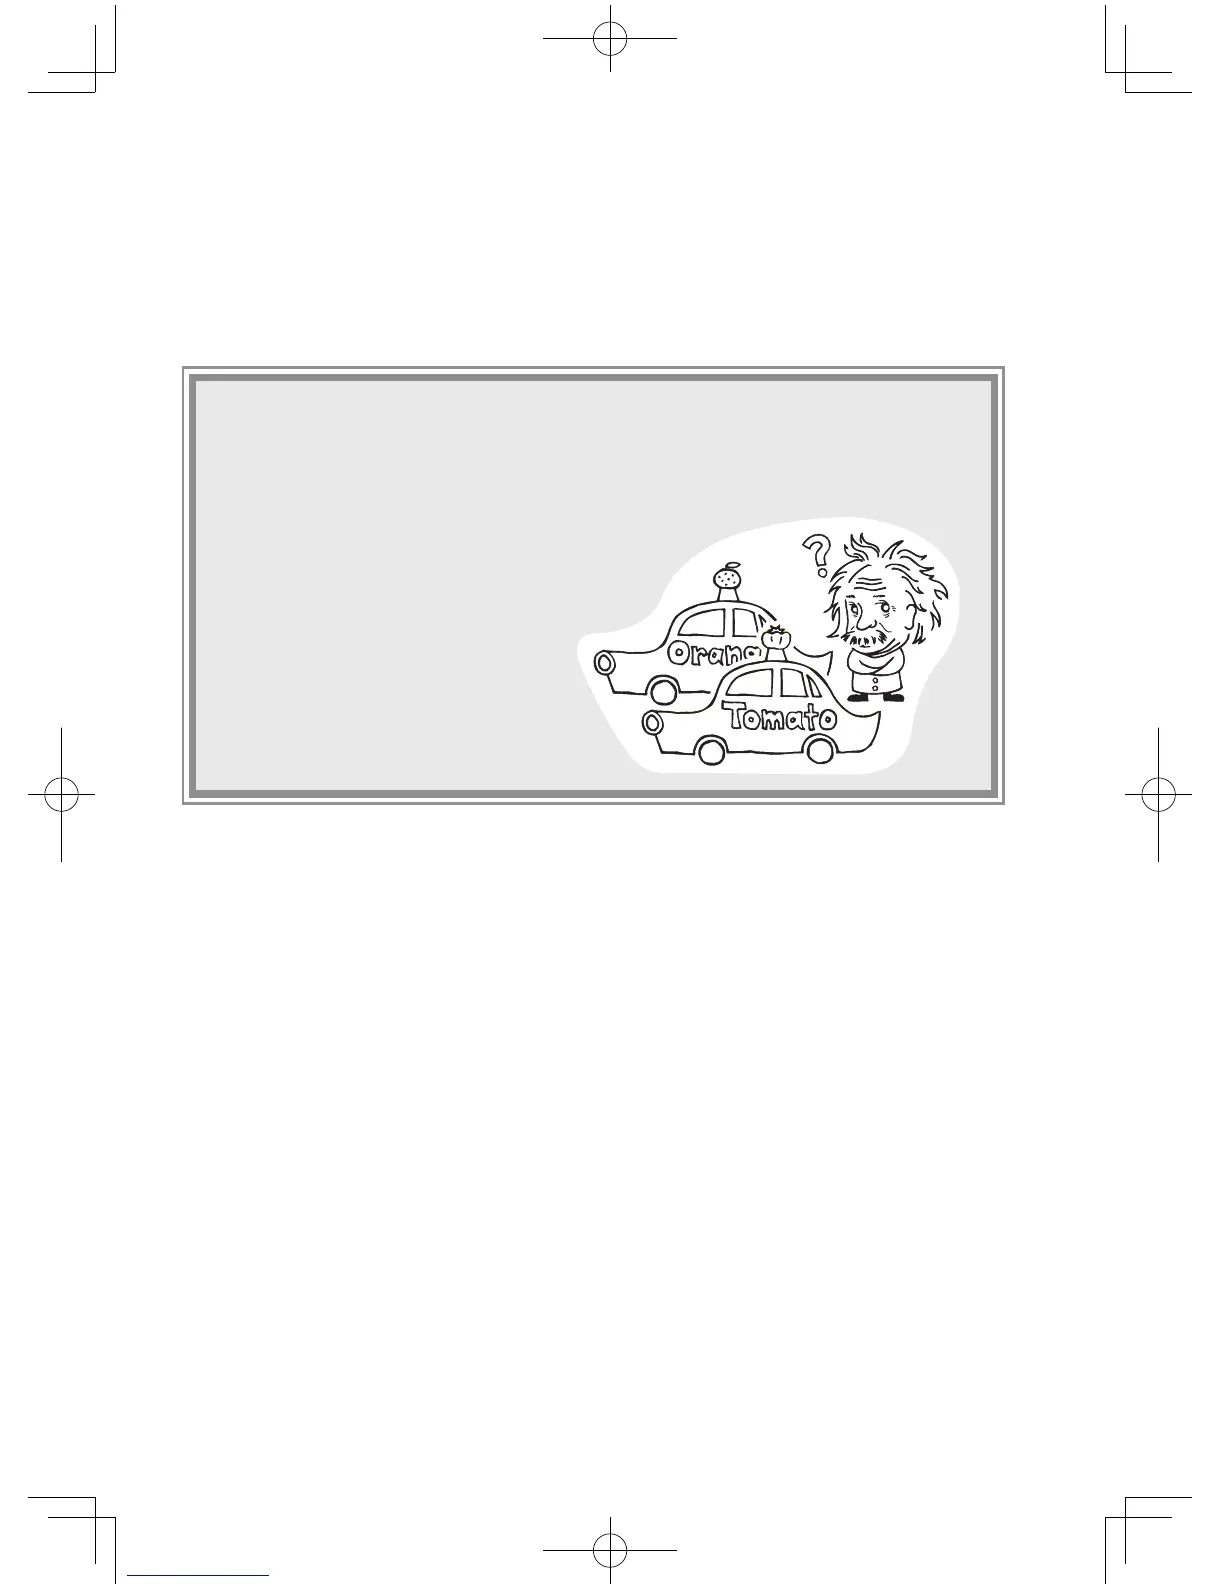
Therearetwotaxicabcompaniesinyourcity,TomatoCabandOrangeCab,
withdifferentfaresystems.TheTomatoCabcharges2.00Eurouponentering
thetaxicab,and1.80Euroforeachmilethetaxitravels.TheOrangeCab,onthe
other hand, charges 3.50 Euro plus 1.20 Euro per mile. This means that taking
theTomatoCabwillinitiallycost
less than going with the Orange
Cab,butwillbemoreexpensiveas
you travel longer distances.
Supposeyouneedtogotoaplace
3 miles away from where you are
now. Which cab company should
you take to save money?
 Loading...