74
Chapter 4: Graphing Features
3. Explanations of Various Graphing Keys
Theexplanationsinthissectionarebasedontherectangularcoordinates(COORD
RECT).
Y
: DisplaystheGraphEquationwindow.Upto10differentequations
can be entered.
Afterthegraphexpressionisentered,press
E
to store the equation.
= : The expression can be represented as a graph.
= : The expression cannot be drawn as a graph.
• Movethecursorpointertothe“=”signandpress
E
to
changebetweento-drawandnot-to-draw.
Note: To switch the window back to the calculation screen, simply press
the
#
key.
G
: Drawsafull-screengraphbasedontheequation(s)enteredinthe
GraphEquationwindow.Tocancelthegraphdrawing,press
O
.
Note: IfnoequationsareenteredintheGraphequationwindow,onlythe
vertical(Y)andhorizontal(X)axiswillbedisplayeduponpressing
the
G
key.
t
: Displays the graph values in a table. The default sample increment
valueofthegraph’sXaxisis“1”.See“11.Tables”onpage93.
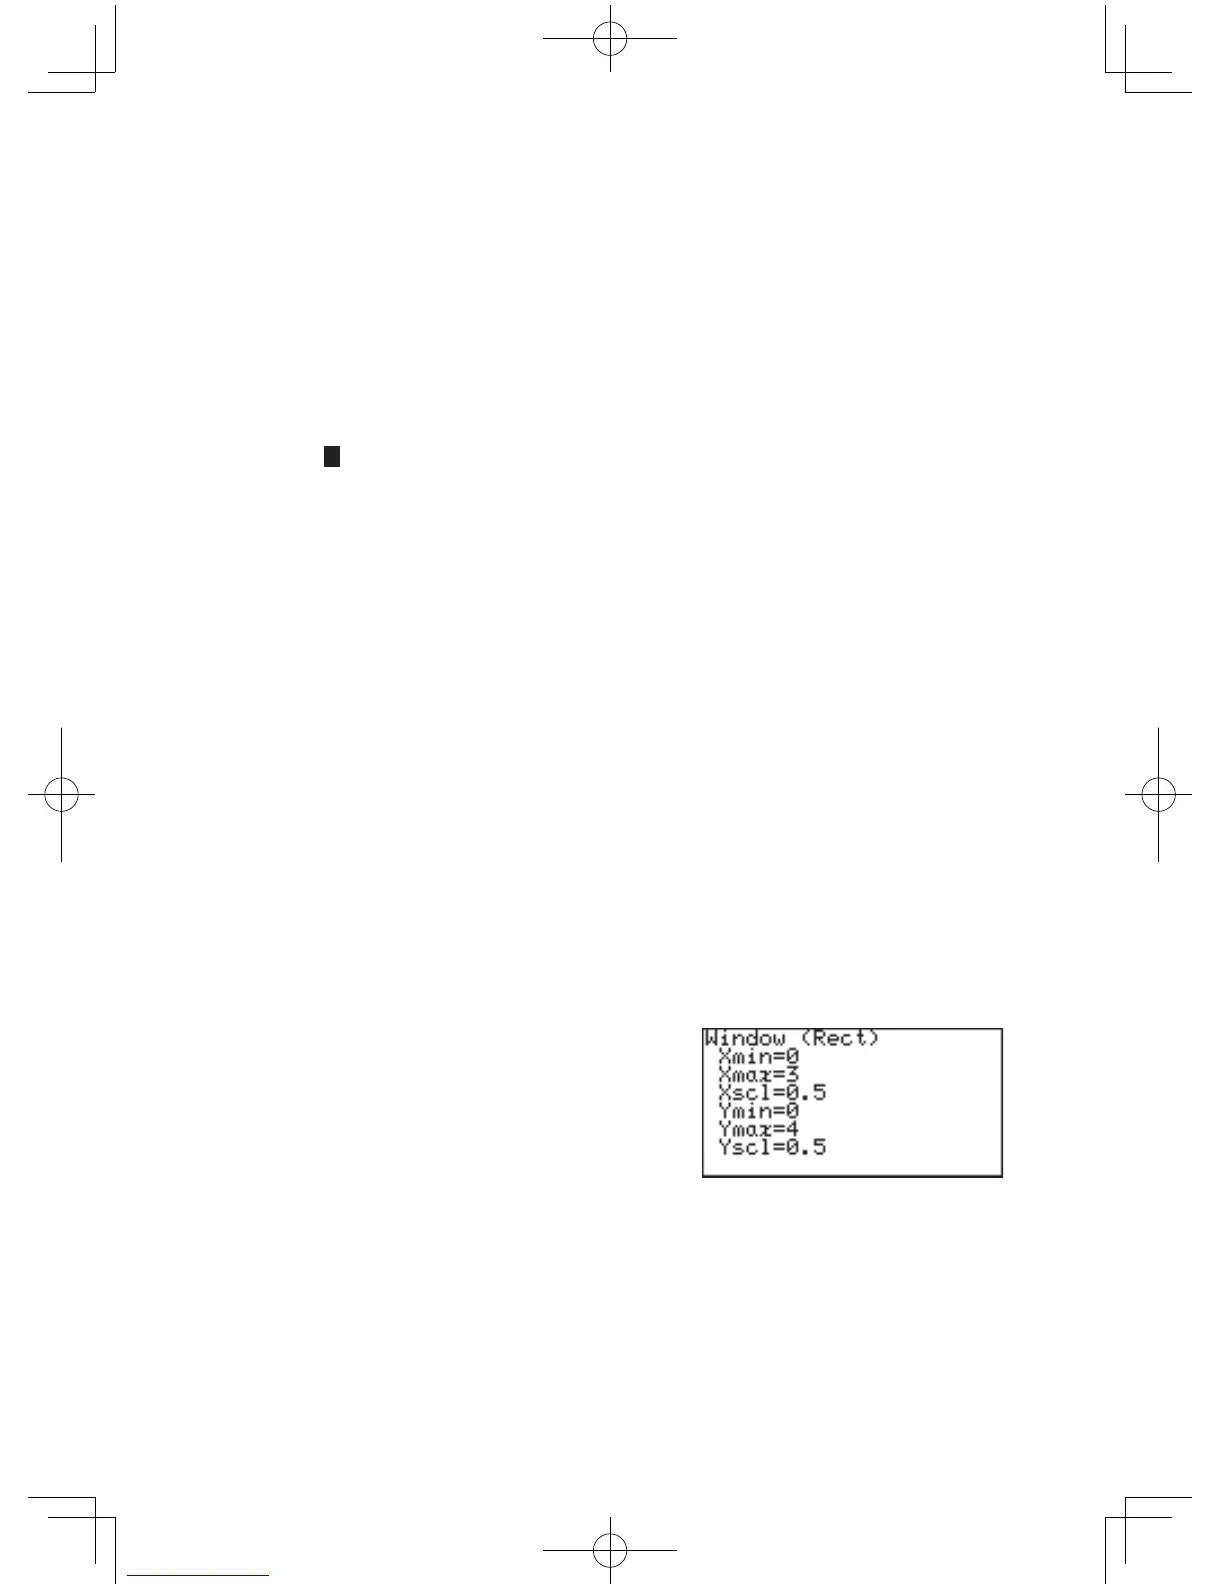
W
: Displays the graph window setup. The setup values — the
minimum/maximumX/Yvalues,andX/Y-axisscale—canbe
changed manually:
1. While the graph is displayed
on the screen, press the
W
key. The following
window appears, with the
cursorsetat“Xmin=”.
2.
TherequiredX-minimumvaluecanbeenteredhere.Thislimitsthe
leftboundaryofthegraphwindow.Forexample,if“Xmin=”issetto“0”,
thentheportionofthegraph’sY-axistotheleftwillnotbedisplayed.
3. Oncethe“Xmin=”valueisentered(“0”,forexample),press
E
. The left limit of the graph is now set, and the cursor
movesto“Xmax=”.
4. Nowtherightboundaryofthegraphcanbeset.Enterthe
requiredvaluehere(“3”,forexample),andpress
E
.