147
Chapter 8: Statistics & Regression Calculations
Chapter 8
Statistics & Regression
Calculations
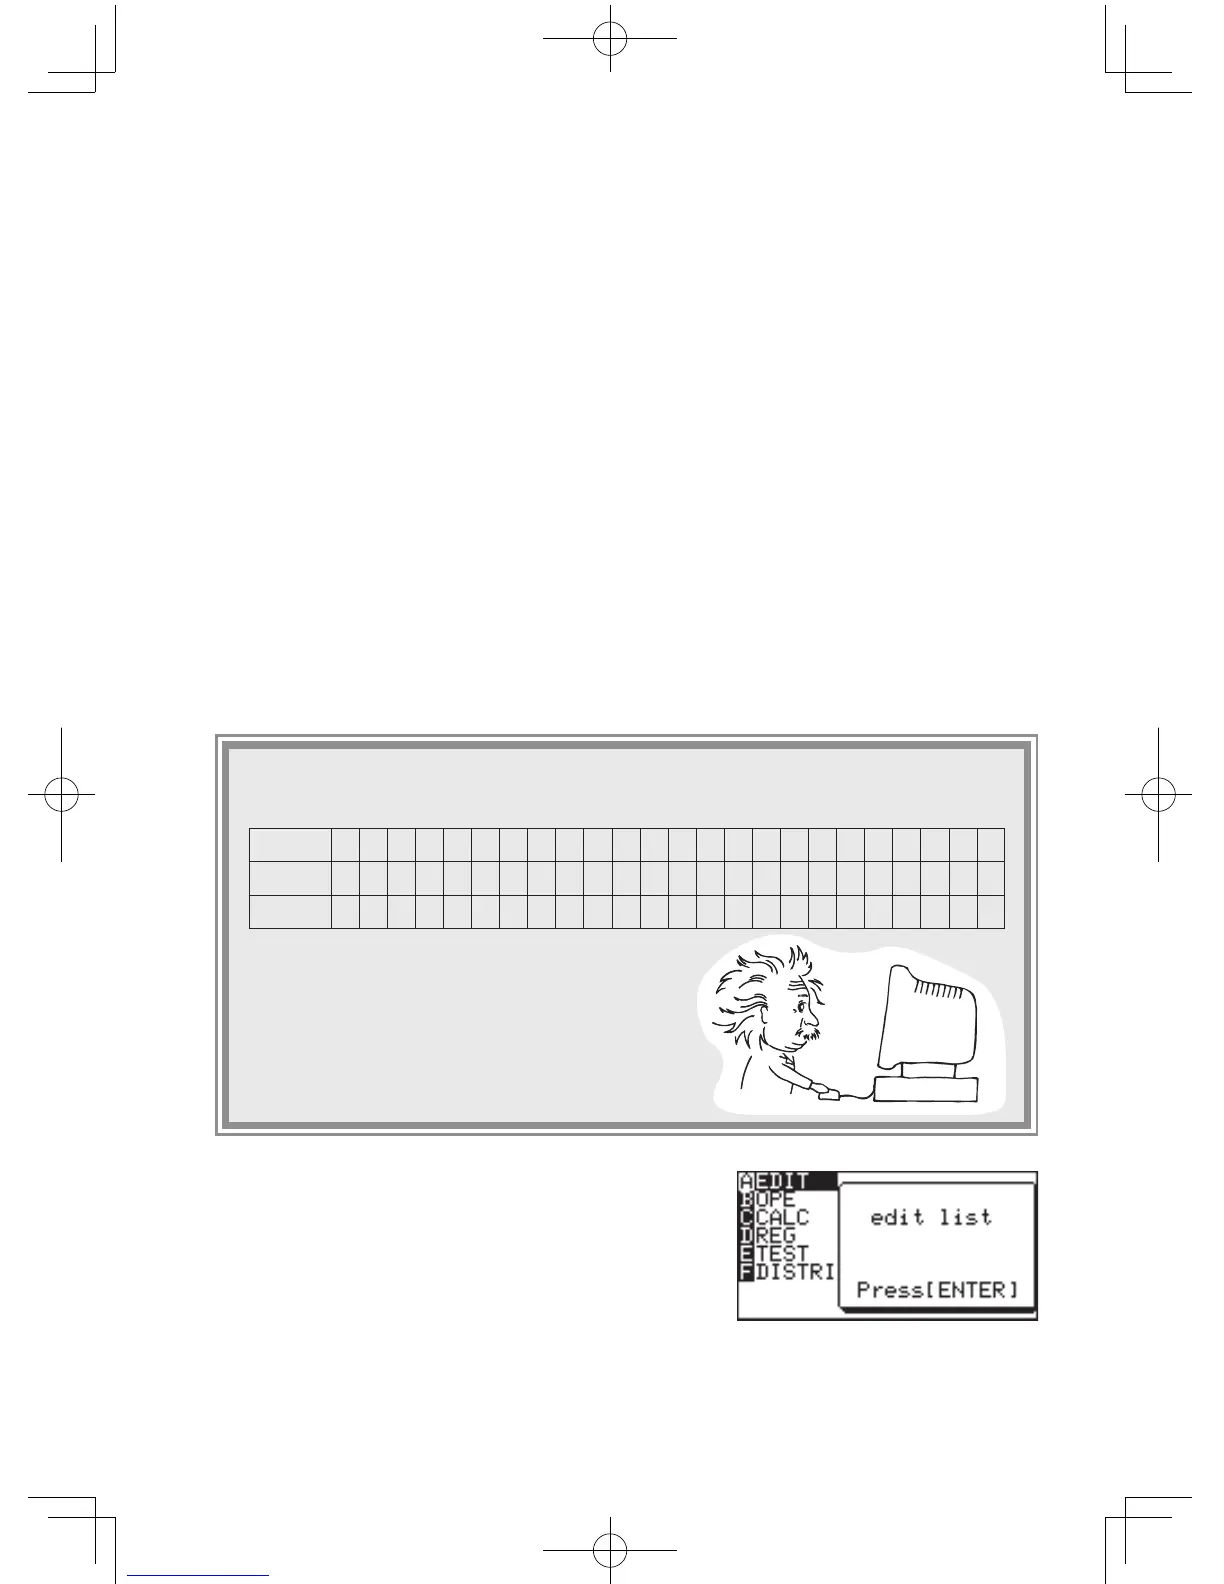
The following table shows the access counts (per hour) of a certain web site
fromSundaymidnighttoMondaymidnight.
Let’sinputthesedataintothecalculator(List
function) and plot a histogram.
1. Press
S
.
TheStatmenuwillappear.
Hours
01 02 03 04 05 06 07 08 09 10 11 12 13 14 15 16 17 18 19 20 21 22 23 24
Sunday
98 72 55 3 6 24 15 30 59 72 55 43 21 10 150 151 135 108 204 253 232 251 75 30
Monday
32 8 12 2 4 19 32 72 95 91 123 201 184 108 95 72 45 38 75 111 153 90 84 35
The following statistical and regression features are available:
• Statisticalcalculationssuchasmeansandstandarddeviations
• Graphingstatisticaldata
• Plottingregressioncurves
• Statisticaltests
• Estimation
• Obtainingcoefcientsfromregressions
• Distributionfunctions
1. Try it!
Opening the list
table to enter
data