148
Chapter 8: Statistics & Regression Calculations
2. SelectA EDIT and press
E
.
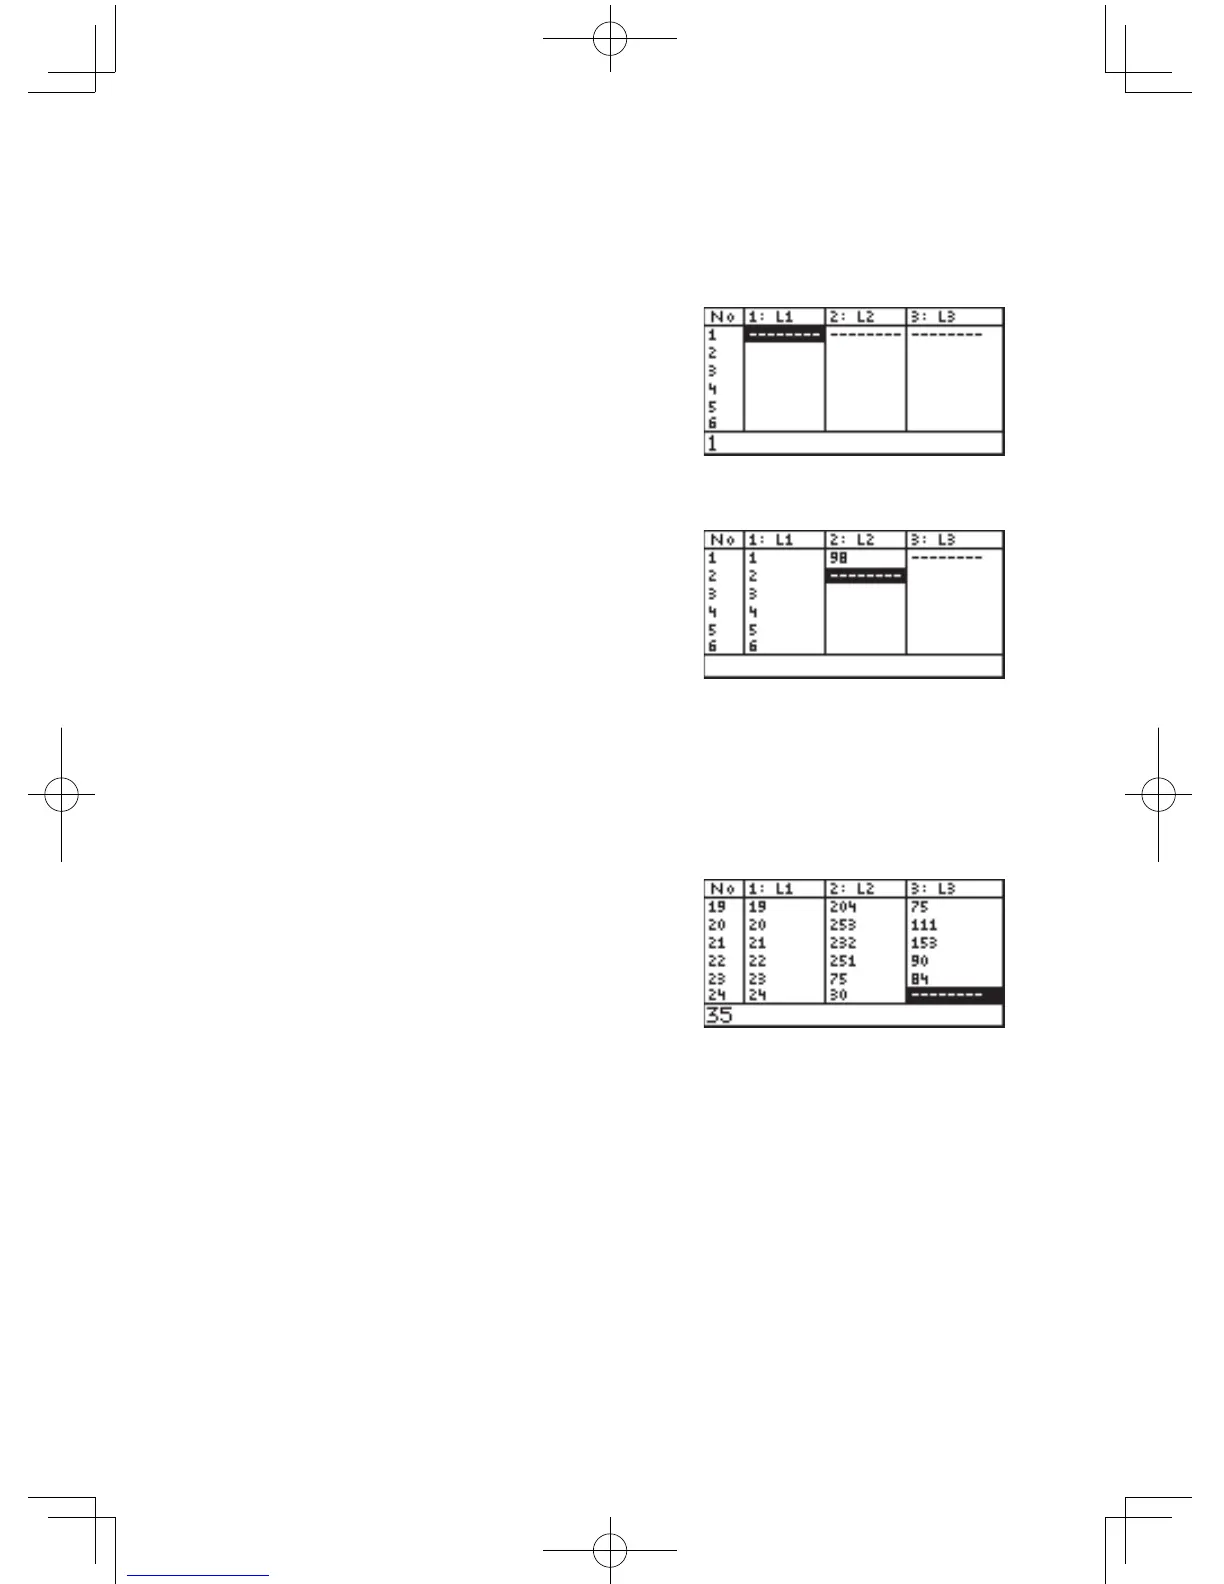
TheListtablewillappear.Initially,allelementsareblankand
thecursorpointerislocatedatL1-1(topleft).
3. Input 1 for hour.
4. 1 will be displayed at the
bottom line of the display.
5. Press
E
to input the
index value.
6. Continuetheproceduretoinput2to24.
7. Press
'
to move the
cursortothetoplineofL2.
8. Input 98 for hour 01.
98 will be displayed at the
bottom line of the display.
9. Press
E
to input the data.
98willappearinpositionL2-1andthecursorwillmovetothe
second row.
10
. Input 72 for hour 02 and press
E
.Continuetheprocedure
to the end of the data.
11
.Press
'
to move the
cursortothetoplineofL3.
12
. Input 32 for hour 01 and
press
E
.
13
.Continuetheprocedureto
the end of the data.
1. Press
;
,
'
,
{
, or
}
to move the cursor
pointer to the target cell.
2. Input the correct number and press
E
.
Nowwecanplotthedatatomakehistograms,brokenlinegraphs
and other statistical graphs.
1. Press
[
.
2. SelectA PLOT1 and press
E
.
The following screen will appear.
Entering hours
(index value)
Entering the
data for Sunday
Entering the
data for Monday
If you enter the
wrong data
Graphing the
statistical data
(Histogram)