149
Chapter 8: Statistics & Regression Calculations
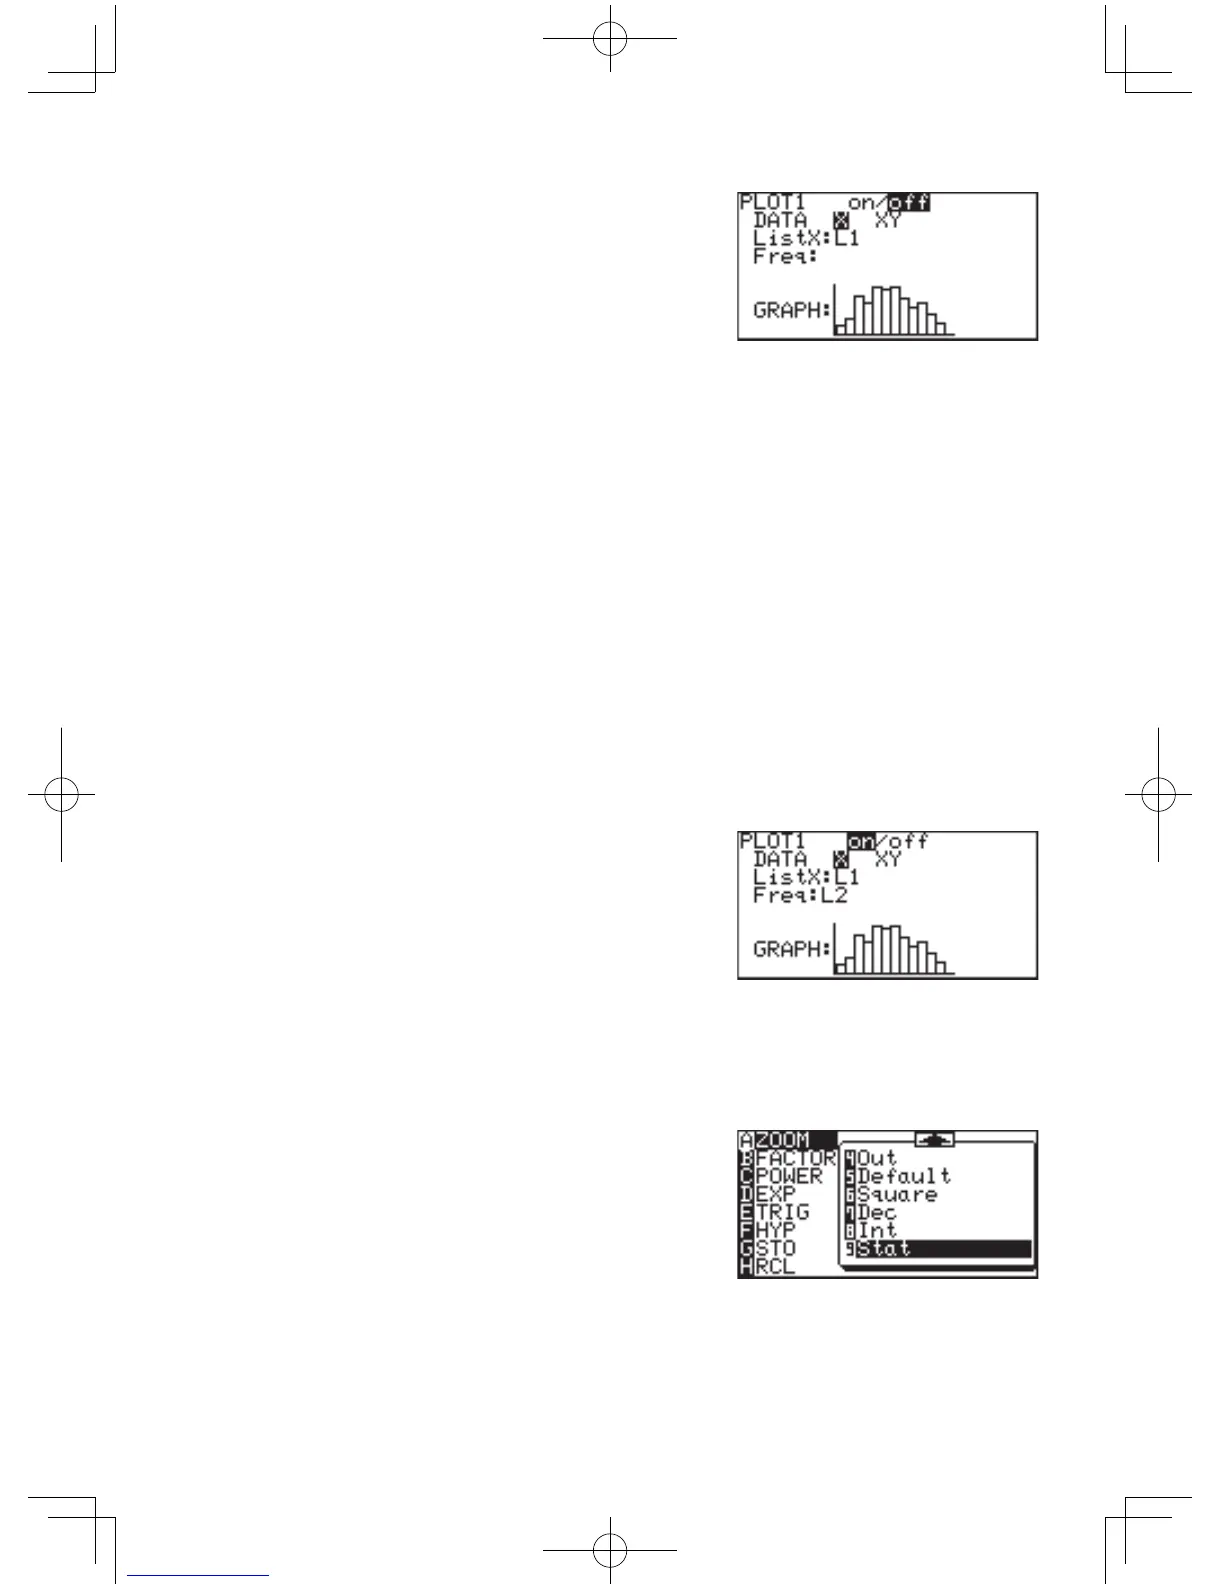
3. The first line shows if the
graph drawing is on or off.
Initially, the graph drawing is
off. With the cursor pointer at
the“on”position,press
E
to set the graph drawing on.
4. Press
}
tomovethecursortothenextline(DATA).
5. SelectXfor1-variableplottingandpress
E
.
DeterminingListXandFreqFrequencyrelatestothenumberof
timesaccessoccurred(L2)attheListXstage.Youcanreferthat
theAccessofListX(L1)houroccurredFreq(L2)numberoftimes.
6. Press
}
tomovethecursortothenextline(ListX).
7. ThedefaultlistnameforListXisL1.Ifanotherlistnameisset,
press
@
1
toenterL1.
8. L1issettobeusedforx-axisitems.
9. Press
}
to move the
cursortothenextline(Freq).
10
.Press
@
2
to enter
L2.
11
.Press
}
tomovethecursortothenextline(GRAPH).
12
. The graph format defaults to histogram, so if that is what is
required, this does not need to be changed.
13
.Press
Z
, and then select
A ZOOM.
14
.Press
'
to move the
cursor right and then press
}
several times.
9 Stat will appear.
Setting the
graph drawing
“on”
Selecting whether
1-variable plotting
or 2-variable
plotting
Select the list
number used for
graphing
Setting the
frequency
Selecting the
graph
Making a graph