154
Chapter 8: Statistics & Regression Calculations
Calculatingtheprevioustwo-variablestatisticalvaluescanbe
performedinasingleoperation.Usea“,”(comma)toseparate
the two variables.
1. Press
#
C
and
S
to display the statistics
menu.
2. Press
C
and then
2
.
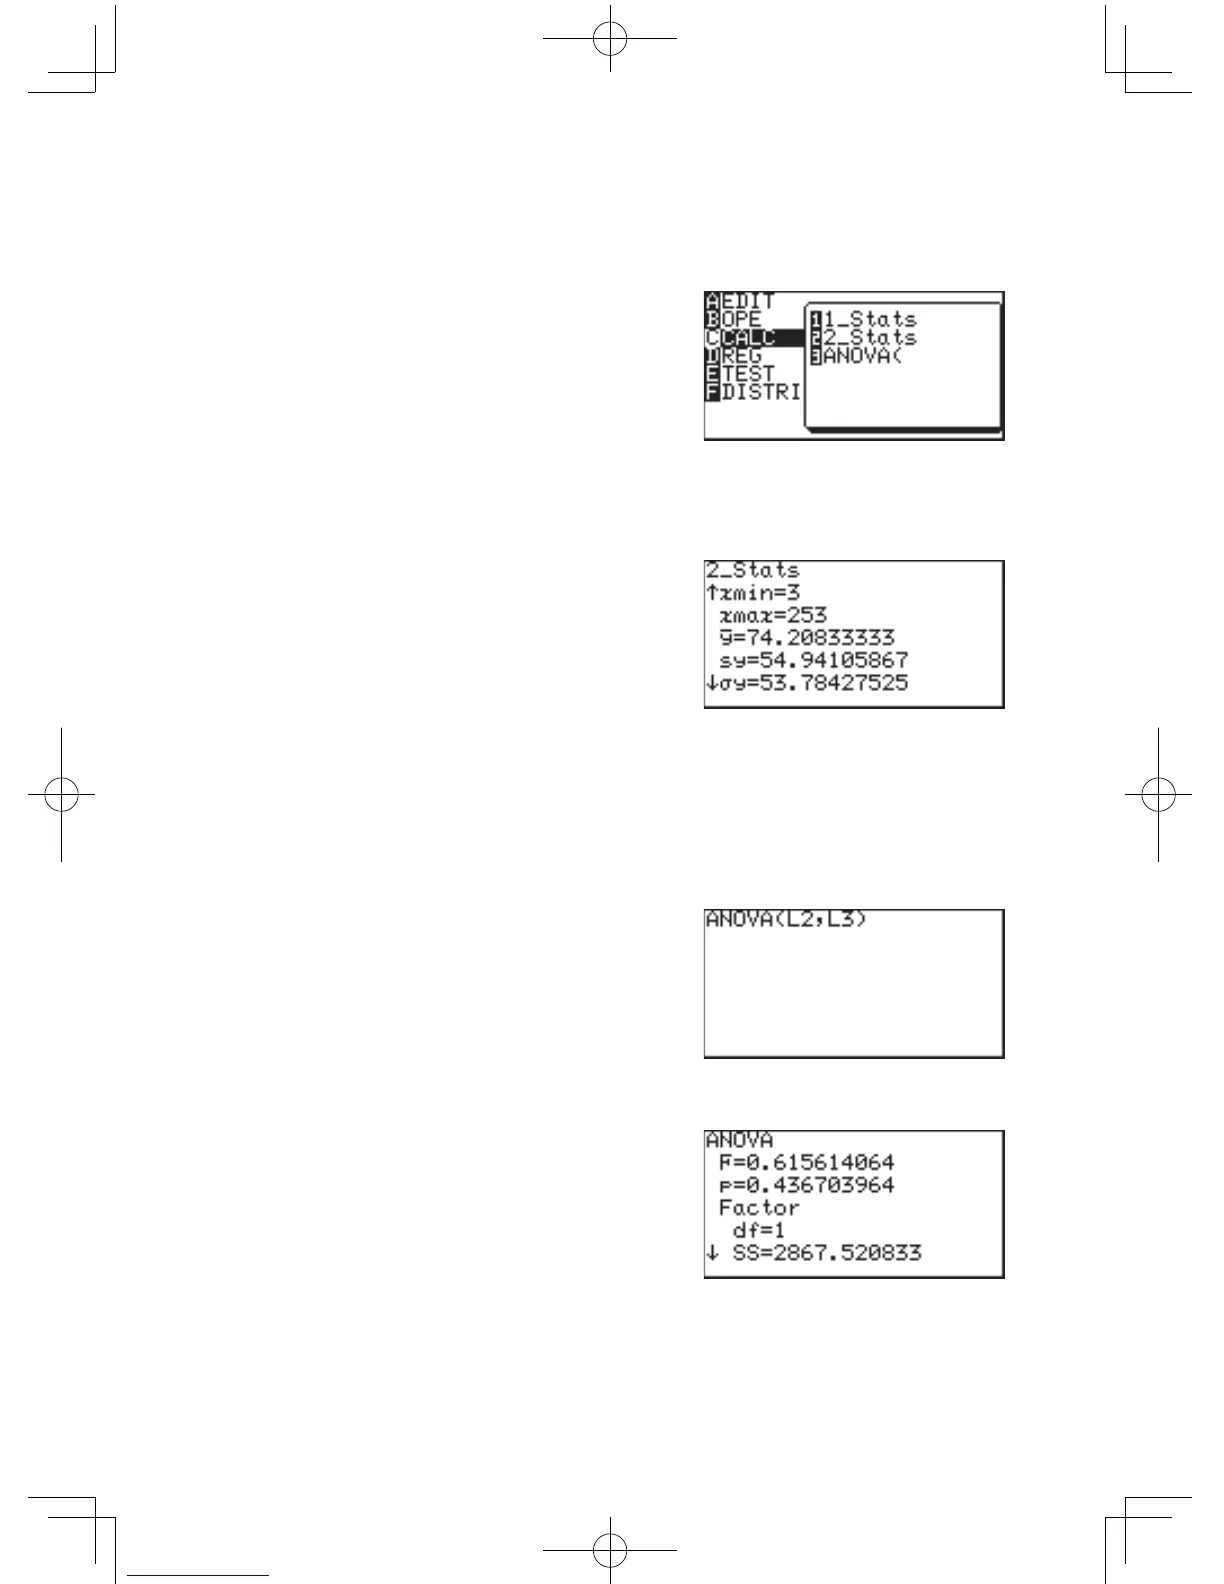
2_Stats will be displayed on
the top line of the screen followed by the cursor.
3. Press
@
2
,
@
3
toenterL2andL3,
and press
E
.
Allthestatisticalvalueswill
be displayed on the screen.
4. Press
}
or
{
to
scroll the screen.
ANOVA( The ANOVA( feature performs an analysis of variance to compare
up to six population means.
1. Press
#
C
and
S
to display the statistics menu.
2. Press
C
and then
3
.
ANOVA(_ will display on the top line of the screen.
3. Press
@
2
,
@
3
)
.
4. Press
E
.
The answer will appear on
the screen.
Each character represents the following variables.
F TheFstatisticfortheanalysis
p The p value for the analysis
df Degrees of freedom
SS Sumofsquares
MS MeanSquare
sxp Pooledstandarddeviation