170
Chapter 8: Statistics & Regression Calculations
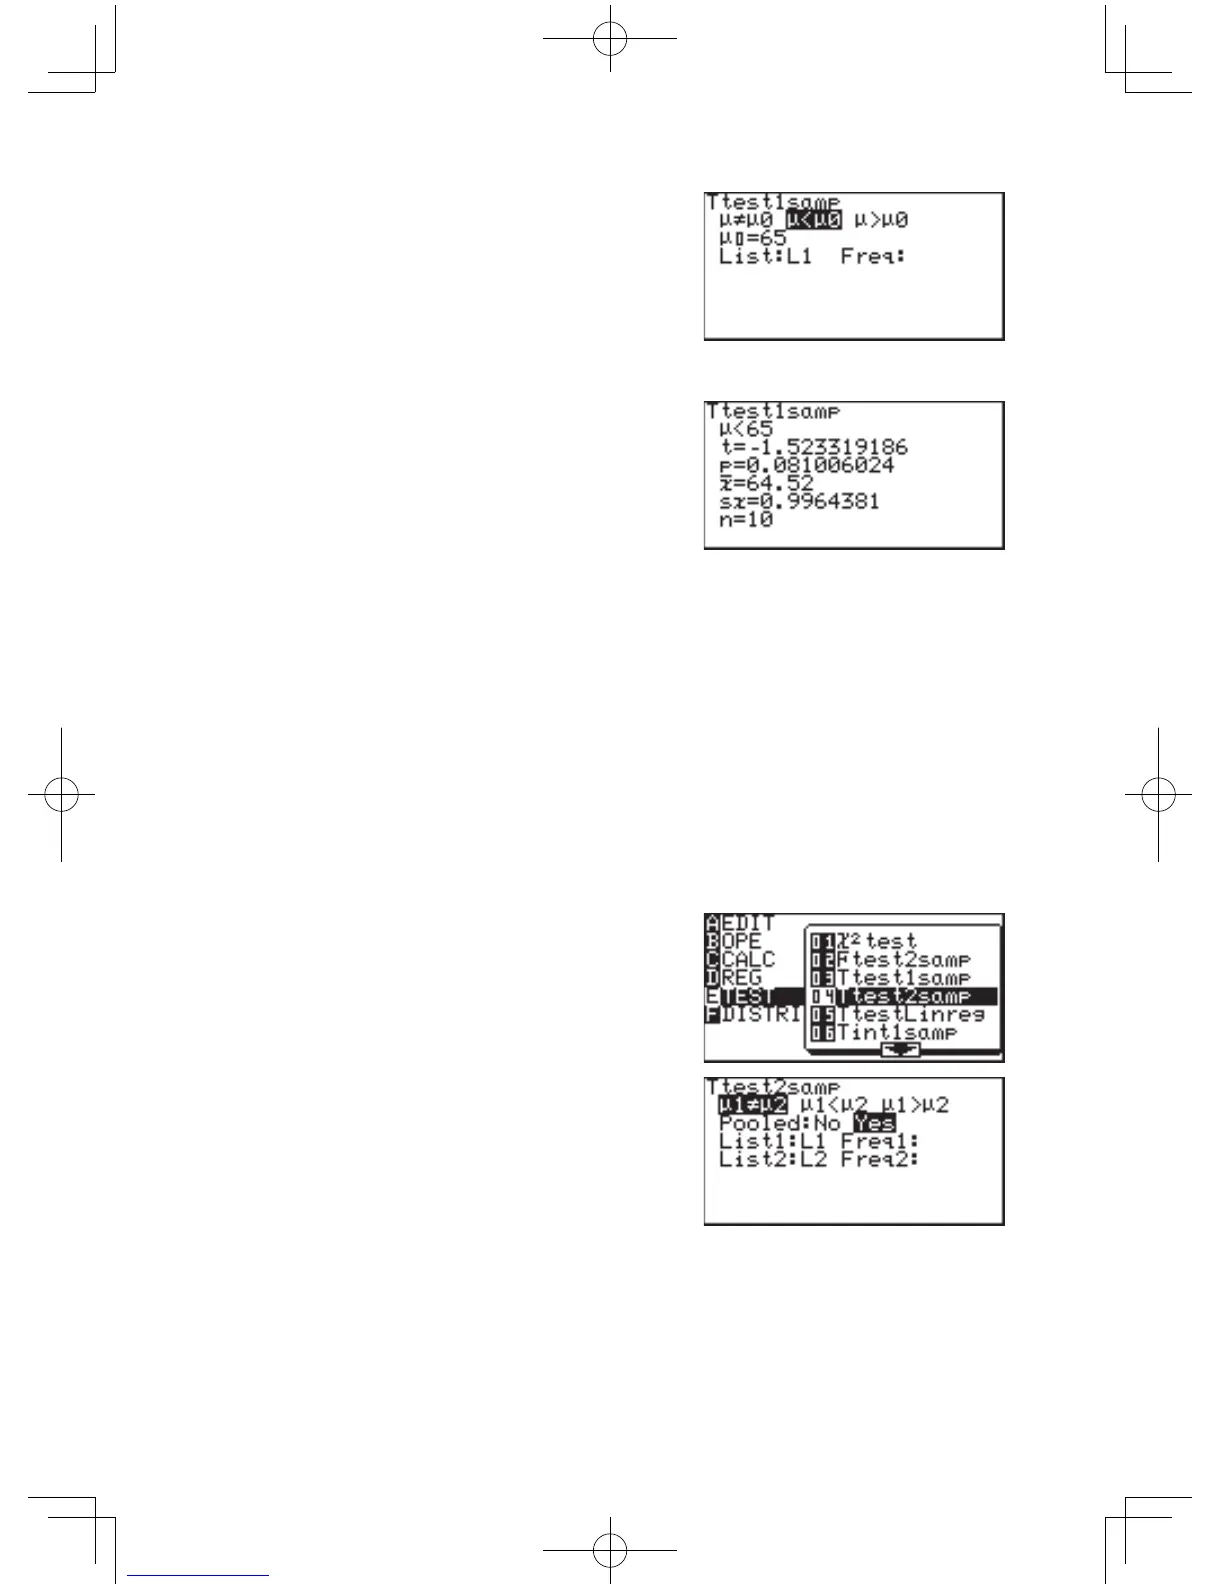
3. Press
'
E
}
to
select
µ
<
µ
0
and press
E
.
4. Move the cursor pointer to
µ
0
and input 65 and press
E
.
5. SettheListtoL1andpress
E
.
6. Press
@
h
.
Answersaredisplayedon
the screen, where t is the t
statistic for the test, p is the
p value for the test and sx
indicates sample standard
deviation.
• Ifthereisnoweightlist,theFreqeldcanremainempty.
04 Ttest2samp Tests two sample means,
µ
1
and
µ
2
.
Example
Test the following two samples;
List1{2.37,2.51,2.43,2.28,2.46,2.55,2.49}
List2{2.63,2.71,2.56,2.61,2.55,2.68,2.42,2.48,2.51,2.65}
1. EntertheabovedataintolistsL1andL2,respectively.
2. Press
S
E
0
4
.
The parameter input screen
will appear.
3. Enter the appropriate value
into each field.
IfnoFreqspecicationdata
isinput,aninitialFreqvalue
of 1 is used.
*Pooledispredictionfor
unknown
s
1
,
s
2
.
Select“No”if
s
1
,
s
2
, are
subjectivelyunequal.
Select“Yes”if
s
1
,
s
2
, are equal.
Calculationisexecutedusingthispredictionasthebasis.