72
Chapter 4: Graphing Features
PROCEDURE
1. First,letussetthecalculator
to the appropriate graphing
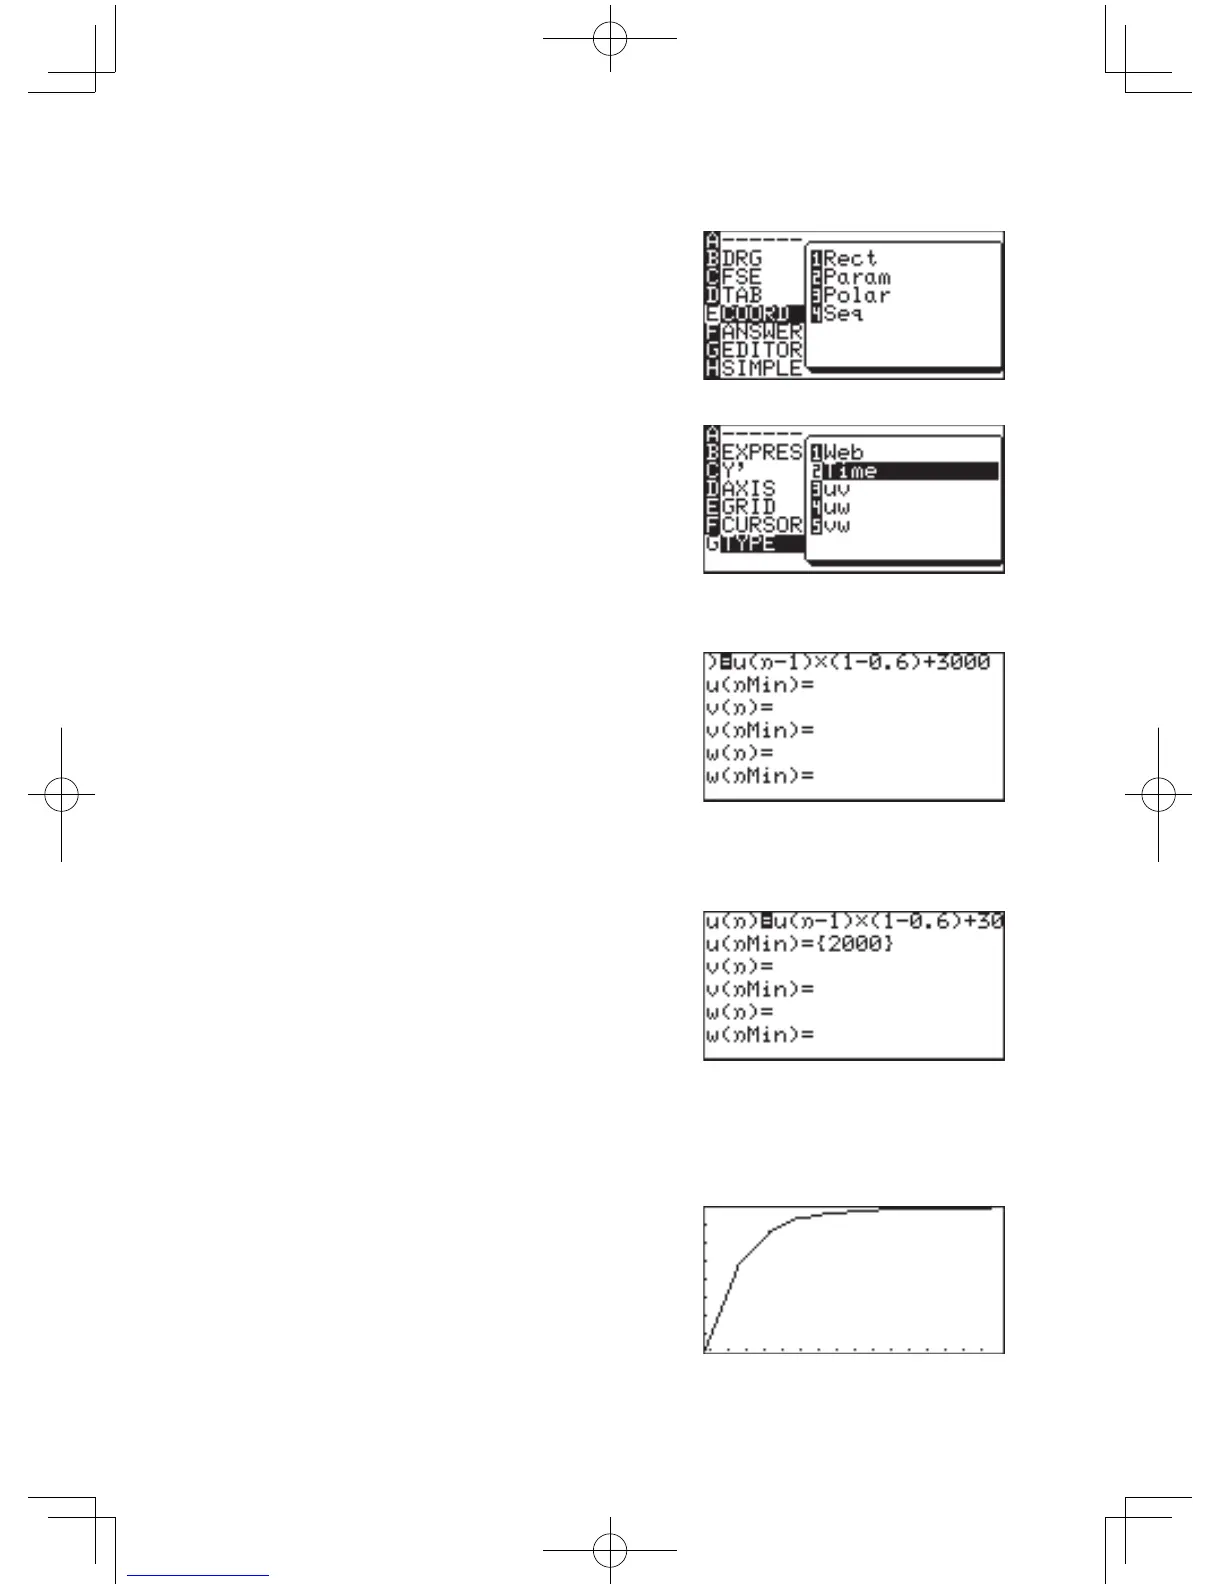
coordinatemode.Press
@
;
to enter the SETUP
menu, press
E
to select
E COORD, then press
4
to select 4 Seq, and press
C
.
2. Wewillusethe“Time”
sequential graph type within
the FORMATmenu.Press
@
f
, press
G
to
select G TYPE, and
2
to
select 2 TIME.
3. Then press
Y
.TheGraphEquationEntrywindowwillopen.
4.
Enter a new equation set
u(n-
1) × (1 - 0.6) + 3000
for u(n)=.
Press
@
u
(
7
)
to enter
u
and press
X
for
n
.Press
E
when done
entering.
Note: Press
C
toclearthepreviousentry.Usingacapitalized“U”or
“N”herewillresultinanerroruponpressingthe
G
key.
5. On the second entry row
(u(nMin) =), enter 2000, then
press
E
.
The figure is automatically
enclosed by braces.
6. The
v
and the
w
entry sets will not be necessary in this case, so
press
C
to clear, then press
E
to move one row down.
Repeatuntilthefourunnecessaryentryrowsarecleared.
7. Press
G
to draw the graph.
8. If the line is outside of the
graph’srange,press
Z
then
1
to select
automaticzoom.
This will only display a small
portionofthegraph,sothegraph’srangewillneedtobe
changed.