87
Chapter 4: Graphing Features
Note: WhencoordinatesystemisPolar,ParamorSeq,only1 Value is
selectableintheCALCmenu.
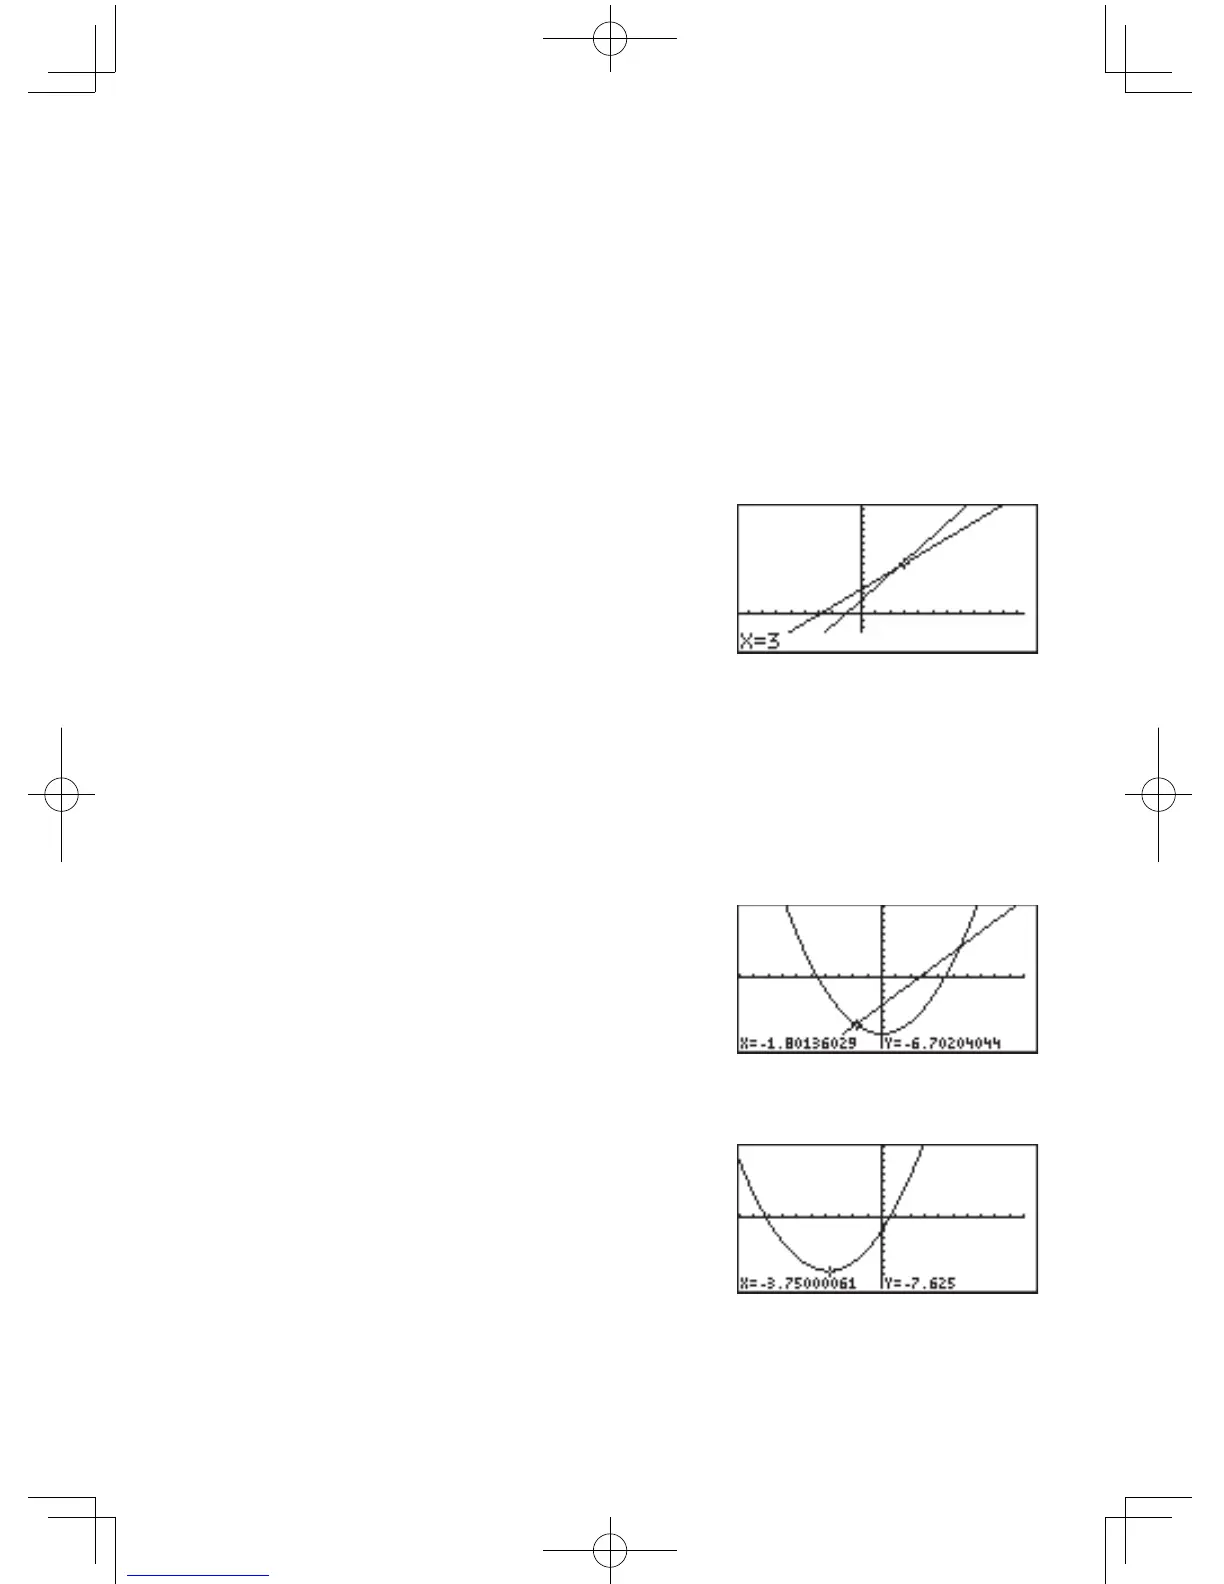
1 Value Withthissub-menutool,theYvaluecanbeobtainedbyentering
anXvalue.Theashinggraphcursorwillthenbeplacedinthat
position on the graph. If more than one graph equation is set, use
the
{
or
}
keys to switch to the equation you wish to work
with.
Note: IftheenteredXvalueis
incalculable, an error message
willbedisplayed.Also,iftheY
value exceeds the calculation
range,then“----”willbe
displayed instead.
2 Intsct With this tool, the intersection(s) of two or more graphs can
be found, where the flashing cursor will be placed. When the
intersectionisfound,thentheX-Ycoordinatesoftheintersection
will be displayed at the bottom of the screen. If there is more than
one intersection, the next intersection(s) can be found by selecting
the tool again.
Note: If there is only one graph
equation entered there will be
no other graph(s) to form an
intersection, so selecting this
tool will result in an error.
3 Minimum Findstheminimumofthegivengraph,andplacestheashing
cursor at that position.
Note: If the given graph has no
minimum value, an error
message will be displayed.
If there are several minimum
values, please use this function
again.
Specific sub-
menus