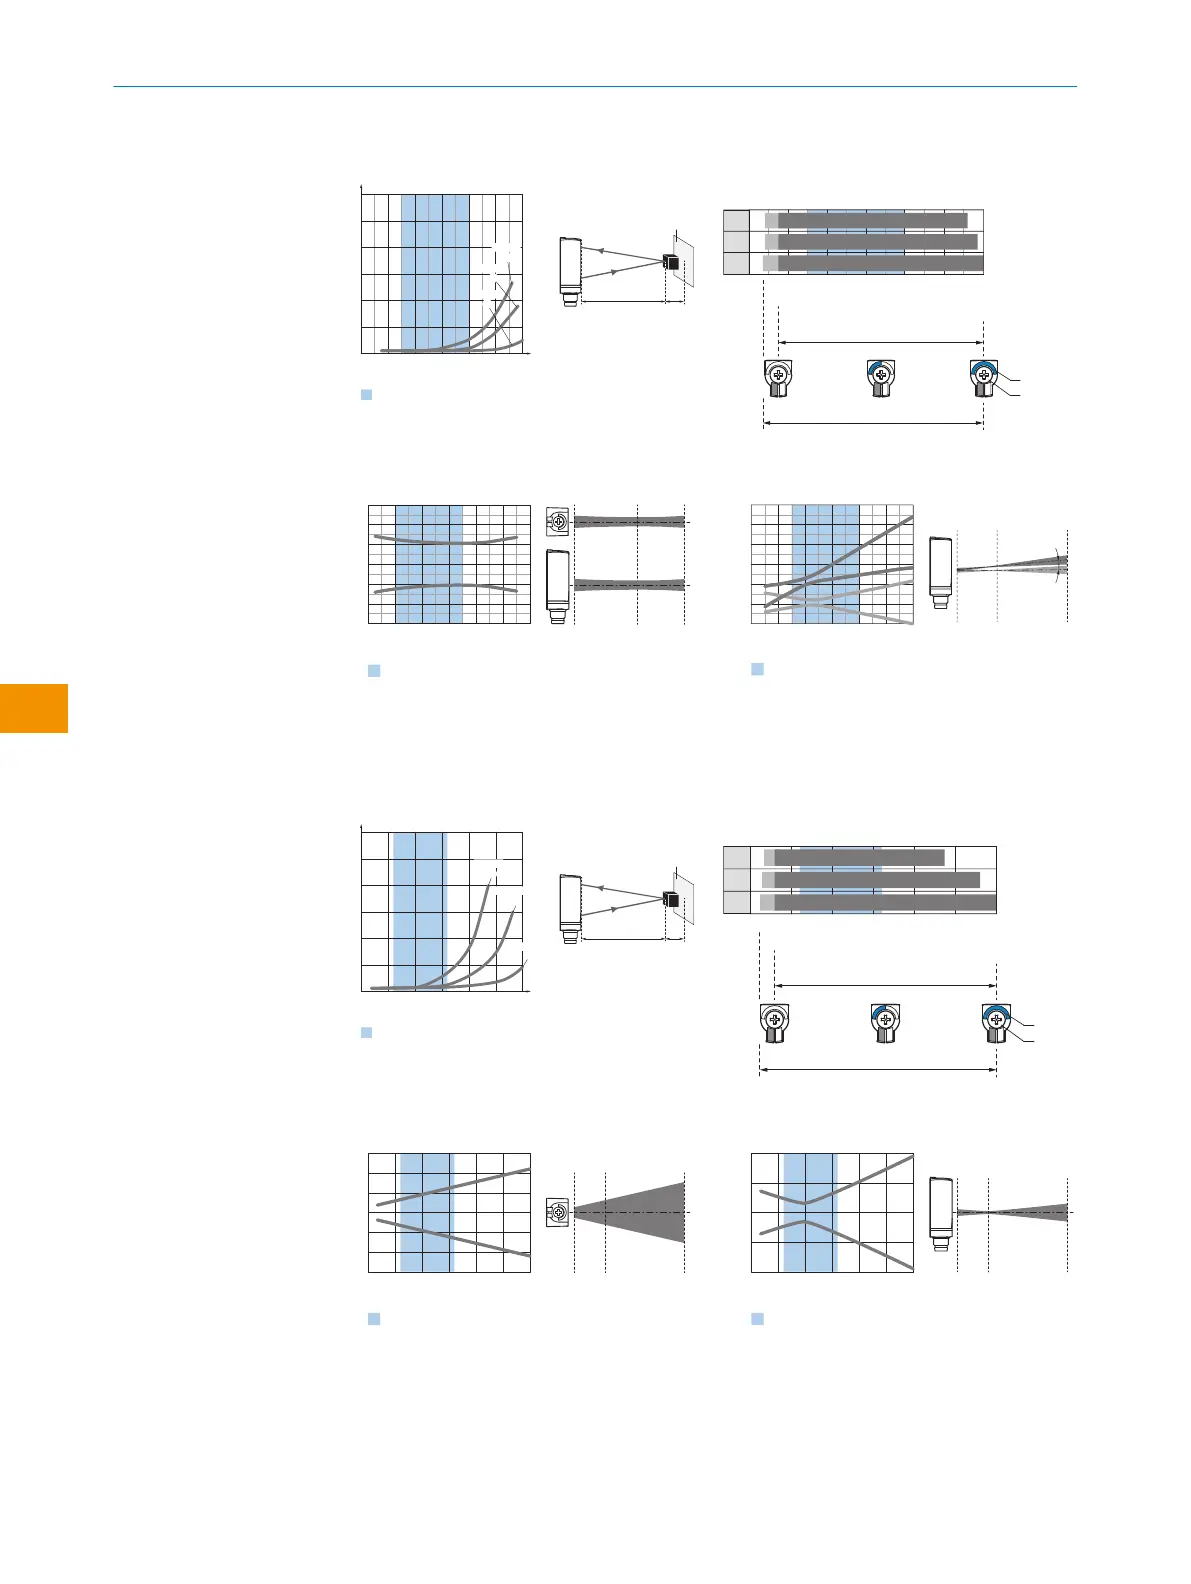
WTB4FT Double Line:
0
20
(0.79)
10
(0.39)
40
(1.57)
30
(1.18)
50
(1.97)
80
(3.15)
100
(3.94)
20
(0.79)
40
(1.57)
60
(2.36)
0
y
x
y
x
Minimum distance in mm (y) between the set sensing
range and white background (90 % remission)
Example:
Safe suppression of the background
White background (90 %)
Black object (6 % remission)
Set sensing range x = 80 mm
Needed minimum distance to white
background y = 5 mm
Distance in mm (inch)
Recommended sensing range for
the best performance
60
(2.36)
120
(4.72)
1
6%/90%
90%/90%
33
2
18%/90%
Figura 34: Curva característica
0
8
15
8
15
7 120
Distance in mm (inch)
112
117
1
2
3
15
80
(3.15)
100
(3.94)
20
(0.79)
40
(1.57)
60
(2.36)
120
(4.72)
D
C
A B
BluePilot
E
F
Figura 35: gráfico de barras
0
Distance in mm (inch)
Dimensions in mm (inch)
4
(0.16)
6
(0.24)
–6
(–0.24)
–4
(–0.16)
0
2
(0.08)
–2
(–0.08)
10
(0.39)
220
(8.66)
80
(3.15)
40
(1.57)
120
(4.72)
160
(6.30)
200
(7.87)
240
(9.45)
130
(5.12)
Recommended sensing range for
the best performance
Figura 36: Tamaño del spot horizontal
0
Distance in mm (inch)
Dimensions in mm (inch)
20
(0.79)
60
(2.36)
40
(1.57)
80
(3.15)
100
(3.94)
120
(4.72)
12
(0.47)
15
(0.59)
–3
(–0.12)
0
6
(0.24)
9
(0.35)
3
(0.12)
10
(0.39)
120
(4.72)
50
(1.97)
Apex angle 4°
Recommended sensing range for
the best performance
Figura 37: Tamaño del spot vertical
WTB4FA SingleLine:
y
x
Example:
Safe suppression of the background
White background (90 %)
Black object (6 % remission)
Set sensing range x = 100 mm
Needed minimum distance to white
background y = 8 mm
0
10
(0.39)
5
(0.20)
20
(0.79)
15
(0.59)
25
(0.98)
50
(1.97)
25
(0.98)
75
(2.95)
100
(3.94)
125
(4.92)
0
Minimum distance in mm (y) between the set sensing
range and white background (90 % remission)
Distance in mm (inch)
Recommended sensing range for
the best performance
30
(1.18)
y
x
18%/90%
2
90%/90%
33
1
6%/90%
150
(5.91)
Figura 38: Curva característica
0
15
15
150
Distance in mm (inch)
118
140
1
2
3
15
D
C
A B
BluePilot
E
F
8
7
6
50
(1.97)
25
(0.98)
75
(2.95)
100
(3.94)
125
(4.92)
150
(5.91)
Figura 39: gráfico de barras
0
Distance in mm (inch)
Dimensions in mm (inch)
0
10
(0.39)
–10
(–0.39)
20
(0.79)
–20
(–0.79)
10
(0.39)
150
(5.91)
50
(1.97)
Recommended sensing range for
the best performance
50
(1.97)
25
(0.98)
75
(2.95)
100
(3.94)
125
(4.92)
30
(1.18)
–30
(–1.18)
150
(5.91)
Figura 40: Tamaño del spot horizontal
0
Distance in mm (inch)
Dimensions in mm (inch)
0
2
(0.08)
–2
(–0.08)
10
(0.39)
150
(5.91)
50
(1.97)
Recommended sensing range for
the best performance
50
(1.97)
25
(0.98)
75
(2.95)
100
(3.94)
125
(4.92)
150
(5.91)
4
(0.16)
–4
(–0.16)
Figura 41: Tamaño del spot vertical
A Distancia de conmutación mín. en mm
B Distancia de conmutación máx. en mm
C Área de visualización
6 PUESTA EN MARCHA
40
I N S T R U C C I O N E S D E U S O | WTB4F SingleLine / DoubleLine 8025300.1FCK/2022-02-14 | SICK
Sujeto a cambio sin previo aviso
es