03/2013 2 Machine information
2.2 Variable monitors – time Series – measurements and measurement series
© Siemens AG 2006-2013 All Rights Reserved
SINUMERIK Integrate AMB, AMC, AMM, Function Manual (FH) - 03/2013
2-41
The trend curve can be generated from the measuring type-specific characteristics
(characteristic over time) by cyclic repetition of individual measurements. This is
used in particular as a basis for condition-oriented maintenance. For this,
measurement series can be generated based on existing individual measurements.
This ensures that the measurement series is based on the same measurement.
How each test is conducted is described in the following Section: Test series on the
machine.
The machine operator can view the measurement results on the operator panel of
the machine and on the PC. Trend curves derived from measurement series can
only be viewed by the operator on the PC.
2.2.2 Operating diagrams
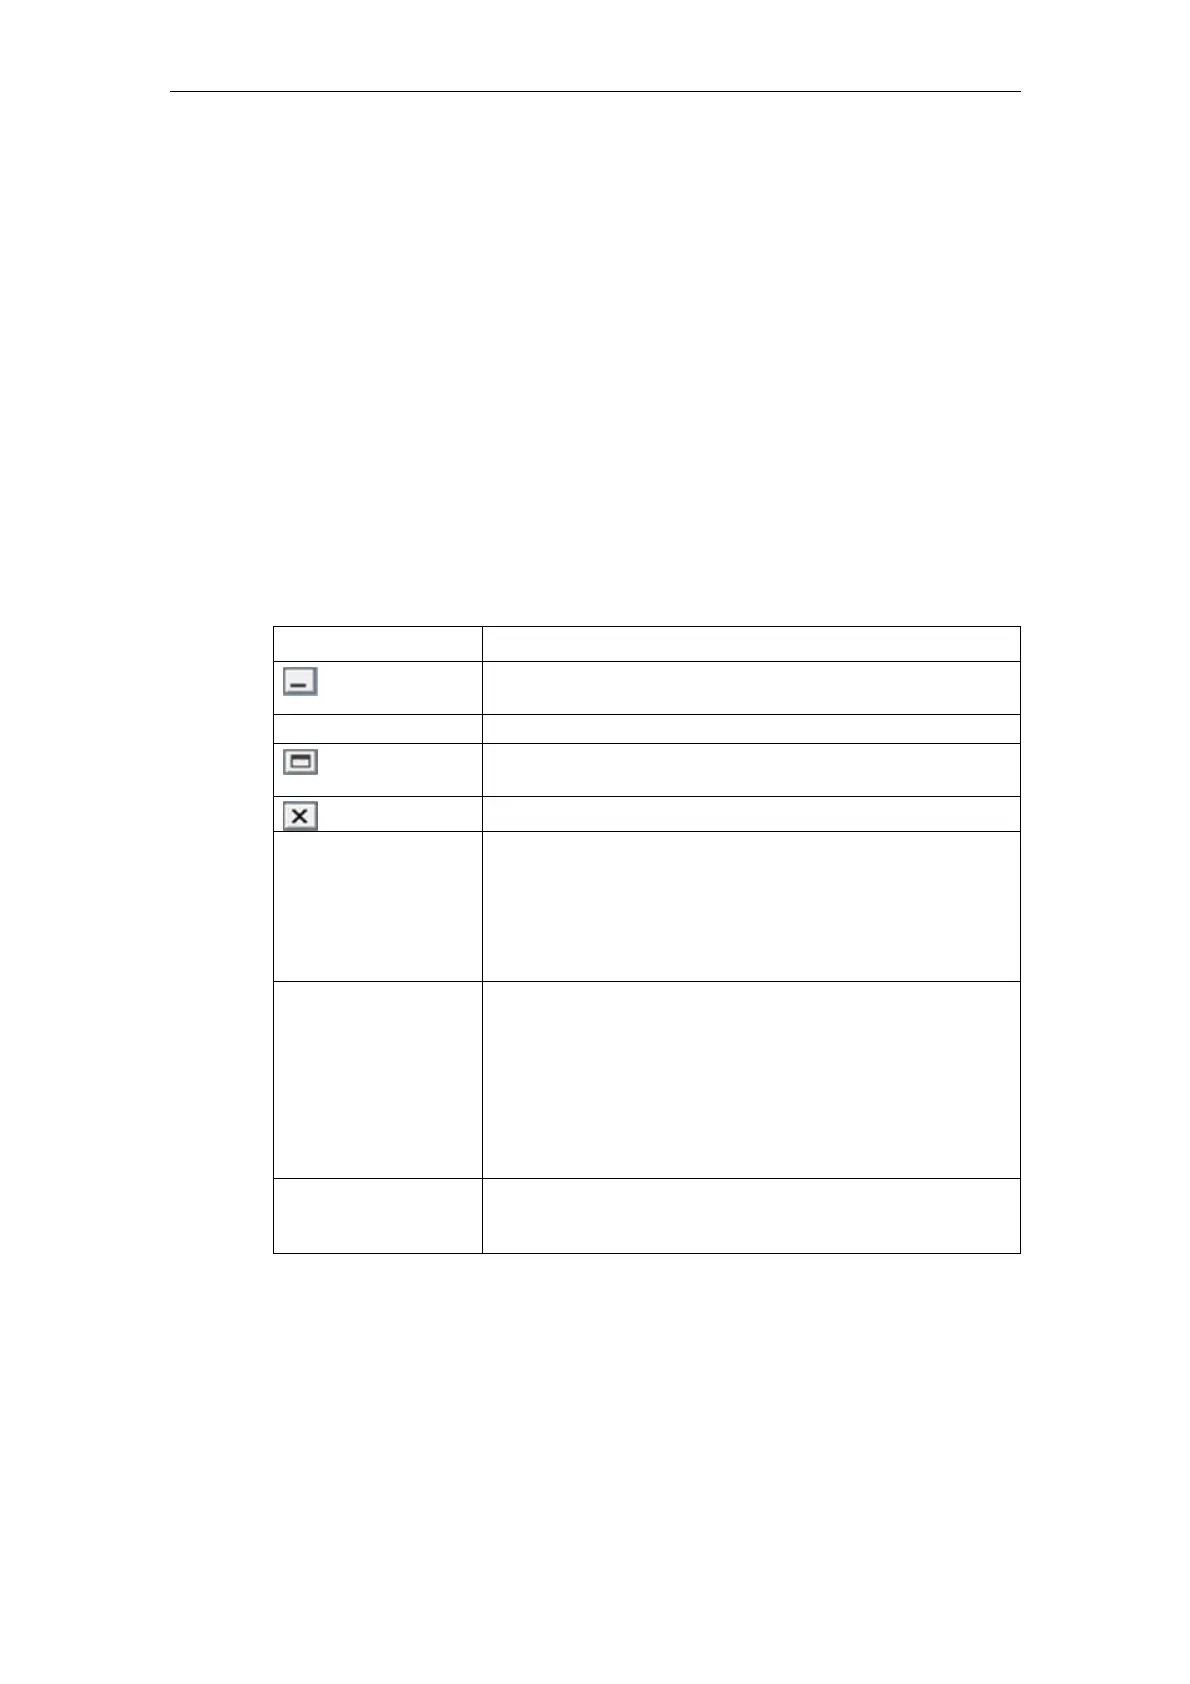
General control elements
Function Description
Reduces the diagram so that only the header line is
visible.
Restore diagram Restores the minimized diagram to its standard size.
Magnifies the diagram so that it fills the entire diagram
space.
Closes the diagram
Setting and
displaying markings
A pair of markings can be set in the diagram. Left-click to
set the first marking. Move the cursor without pressing any
buttons to position the second marking, and then left-click.
The markings can be reset if you wish.
The markings are deleted by means of the "Delete
markings" function in the "Display" menu.
Display in new
diagram
If you click the "Display in new diagram" button on the
right-hand side next to the drop-down list box, a new
diagram of the same type will be displayed below the
diagram that is already shown.
The newly generated diagram adopts all display
properties of the original diagram (selected characteristic,
marks, display, selection and sequence of time series,
etc.).
Export diagram The data points represented in the diagram are saved in a
file in "XLS" format. If Excel is not available, an XML file is
created.
 Loading...