| 23
Charts | NSO-II Operator Manual
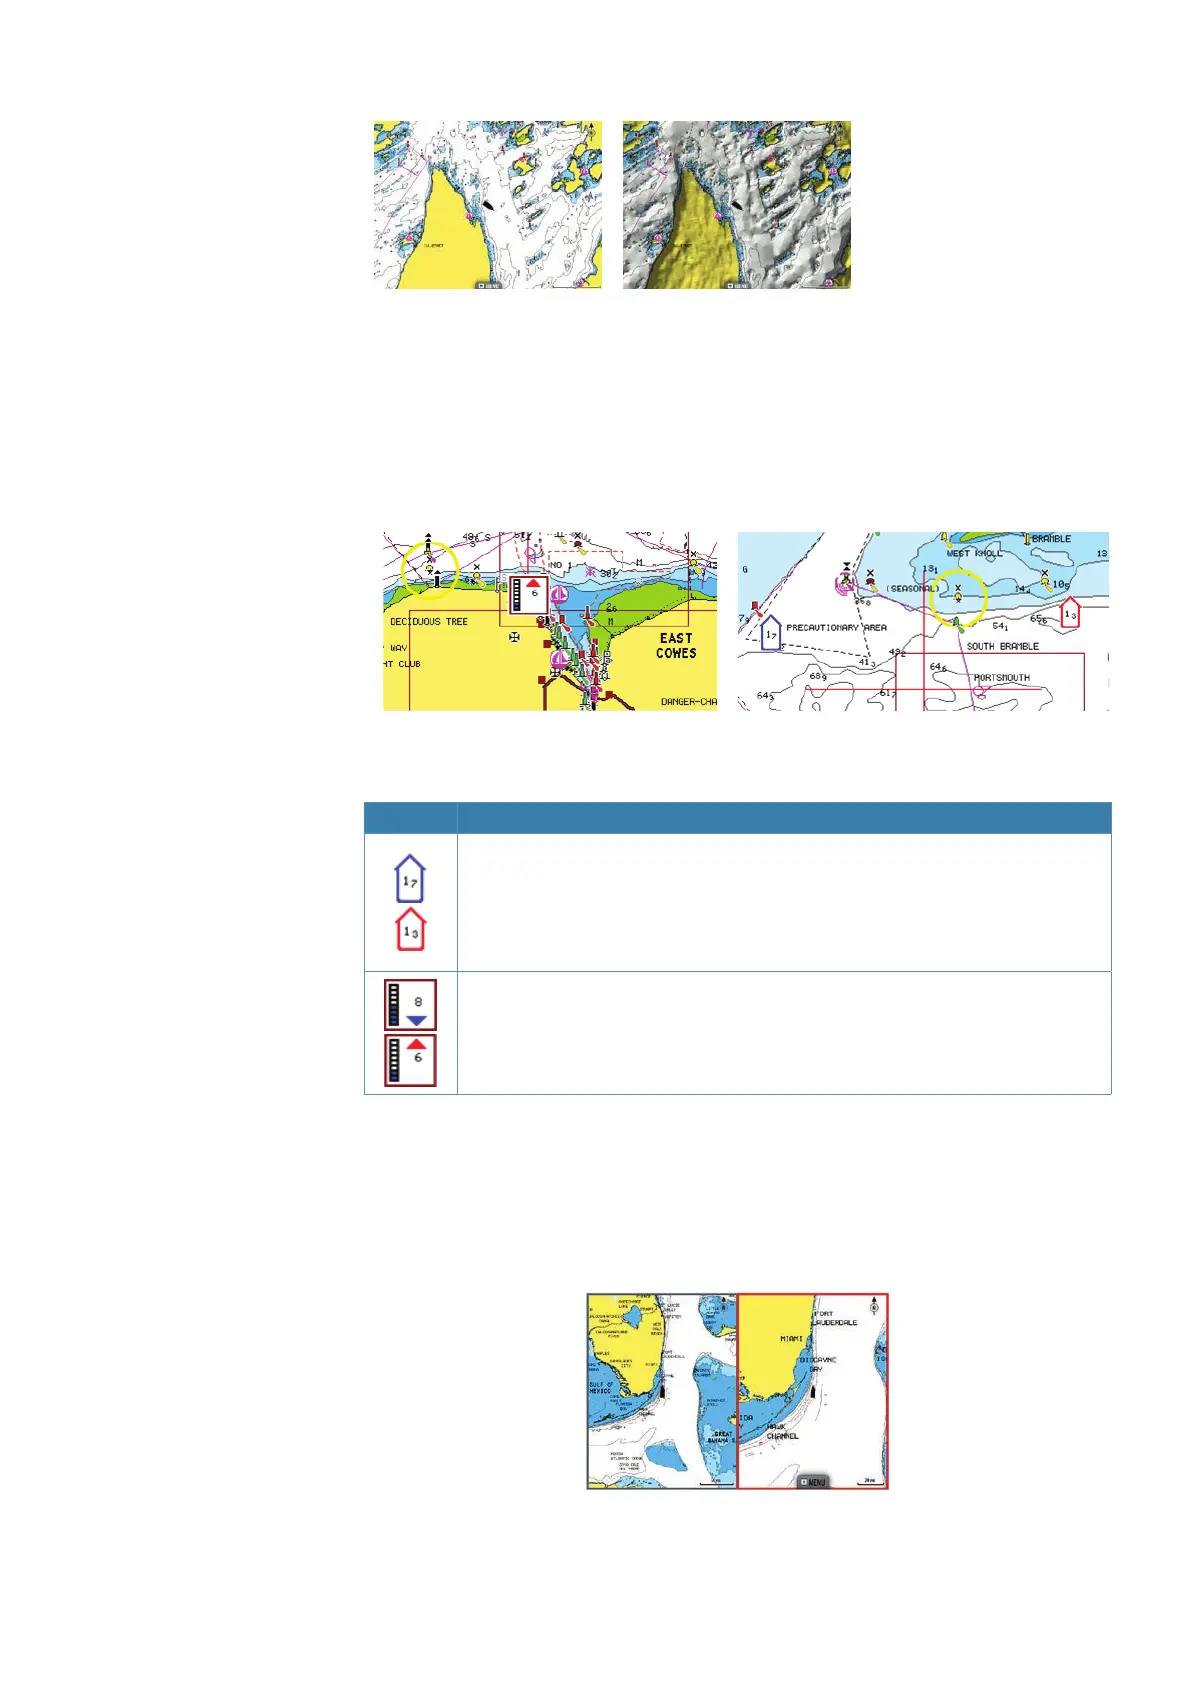
Traditional 2D chart Chart with shading
Dynamic tides and currents
Shows tides and currents with a gauge and an arrow instead of the diamond icons used
for static tides and current information.
The tide and current data available in Navionics charts are related to a specic date and
time. The NSO-II animates the arrows and/or gauges to show the tides and currents
evolution over time.
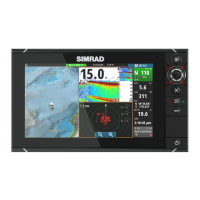
Dynamic Tide information Dynamic Current information
The following icons and symbology are used:
Icons Description
Current speed.
The arrow length depend on the rate, and the symbol is rotated according to
ow direction. Flow rate is shown inside the arrow symbol.
Red symbol used when current speed is increasing,- blue symbol when
current speed is decreasing.
Tide height.
The gauge have 8 labels and is set according to absolute max/min value of
the evaluated day.
Red arrow used when tide is rising,- blue arrow when tide is falling.
¼ Note: All numeric values are shown in the relevant system units (unit of measurement) set
by user.
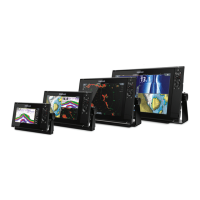
Easy View
Magnifying feature increasing the size of chart items and text.
In the split screen image below the Easy View is turned ON in the right panel.
¼ Note: There is no indication on the chart showing that this feature is active.