Scanner Viewing and Saving Data
35
6.4.1 About the Data Buffer
The diagnostic tool has the capability to collect, store and save PID data utilizing
internal storage memory and buffer memory.
When Data is displayed onscreen, a data buffer automatically starts to store it in
buffer memory. The data buffer runs continuously (storing data) until the Pause,
Clear, or Save icon is selected.
Buffer memory is limited to a predetermined “total” size. When buffer memory
reaches it’s full capacity, the data buffer will continue to store new data, however
earlier stored data will be removed to allow room for the new data being stored.
The most recent data is always available for review when Pause is pressed, and
can be reviewed using the toolbar controls.
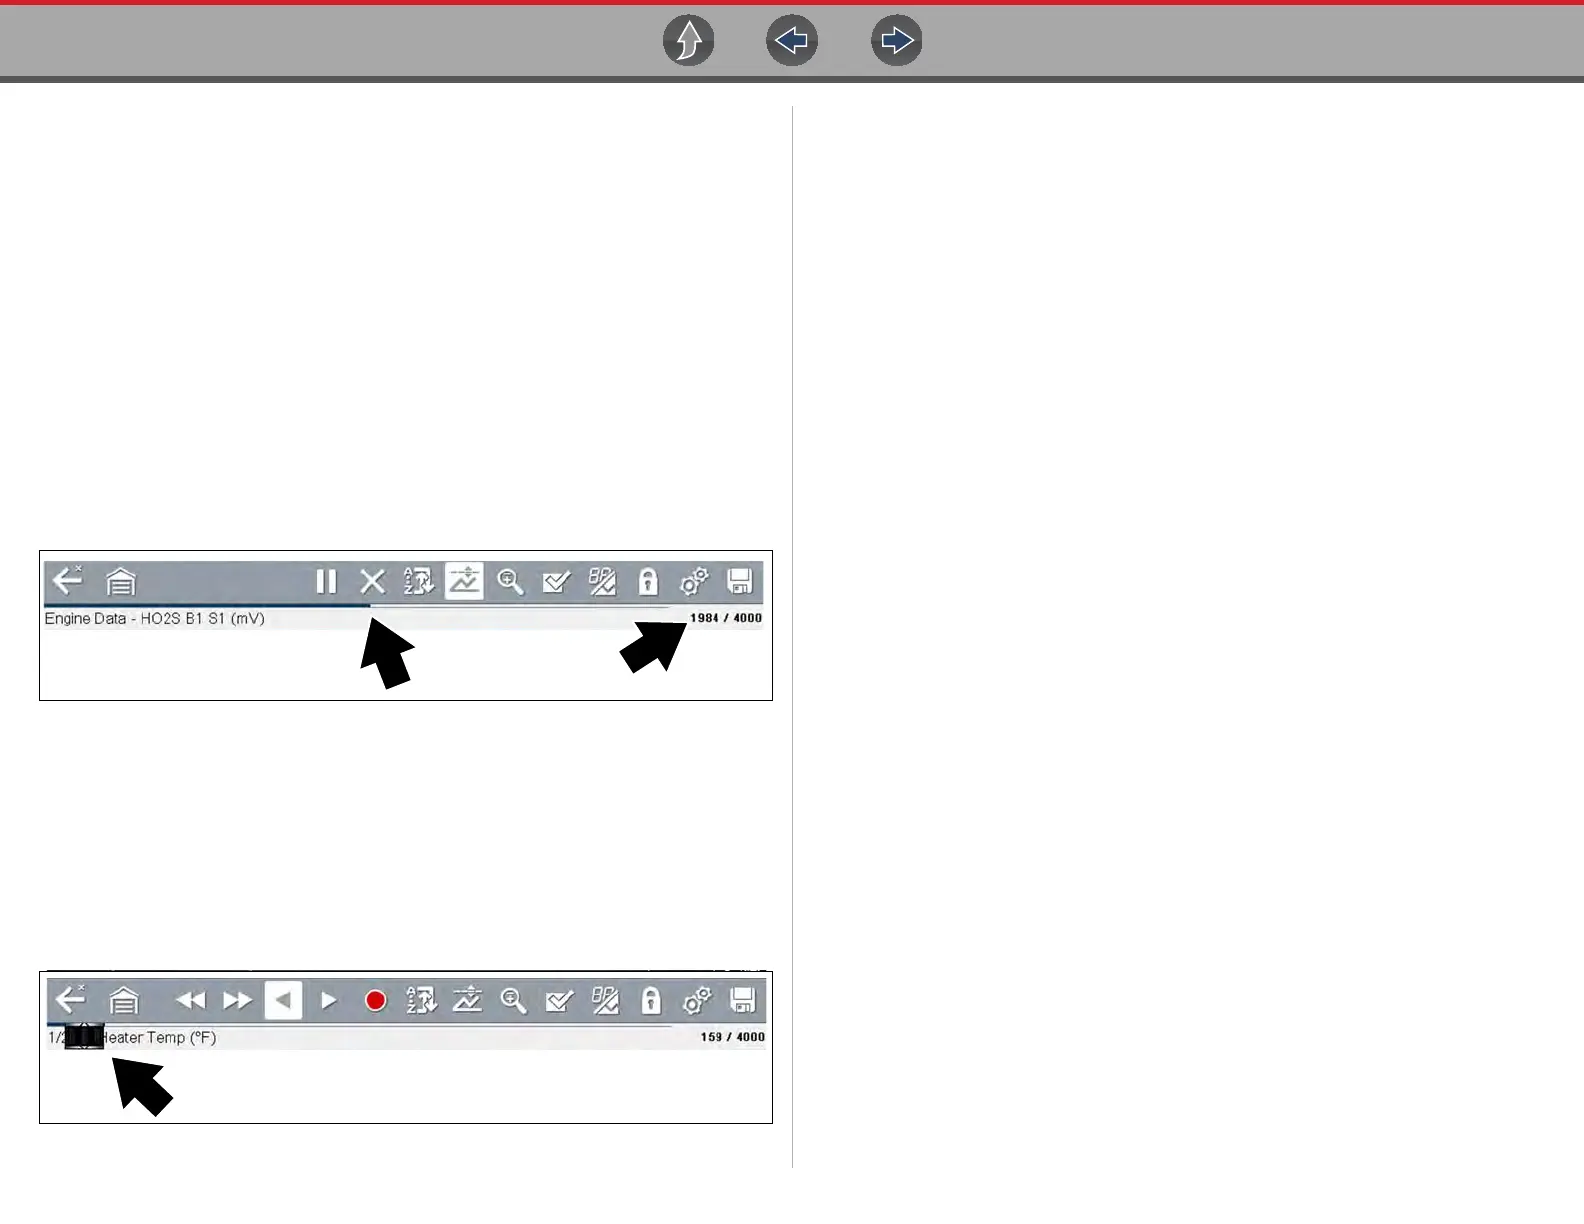
The Data Buffer Indicator (Figure 6-10 left arrow) can be used to visually see the
amount of stored buffer data. This graphical indicator uses a bar graph to show how
much stored data is in the memory buffer.
Figure 6-10
The Data Buffer Position Counter (Figure 6-10 right arrow) indicates:
– first value = the numerical position of the current frame of data (displayed)
within buffer memory
– second value = indicates the maximum data buffer size value (e.g. 4000)
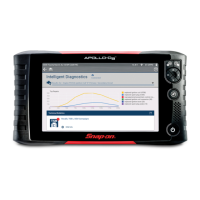
During data review (Figure 6-11), a slider on the bar graph indicates the position of
the current frame of data (displayed) in relation to the entire memory buffer
contents.
Figure 6-11
6.4.2 About Cursors
Vertical cursors are automatically displayed (in graphical PID views) to mark
specific data reference points.
Gray (Pause/Save) - If you select Pause or Save while collecting data, a vertical
gray cursor is automatically placed at that point in the data to indicate where the
data was paused or saved.
• Each time Pause is pressed an additional cursor is added, and appears when
Record is pressed to resume data collection.
• Each time Save is pressed an additional cursor is added, and appears when
the data starts again after a slight pause to save the file.
• Cursors are displayed in all PIDs as reference markers.
• Cursors are retained and appear in saved data files.
Blue (Current Position) - If you select Pause while collecting data, a vertical blue
cursor is displayed as an indicator to your position in the data and is denoted by the
current position value in the counter display.
• Cursors are displayed in all PIDs as reference markers.
• Depending on the amount of data saved the blue cursor may be initially located
on the far left next to the description, or the far right next to the scroll bar making
it difficult to see. If this happens, use the control icons (Step/Skip) to move the
data until you can see the cursor.
Red (Triggered PID Activation Point) - When using triggers, a vertical red cursor
is displayed in the data of the triggered PID at the point where the trigger was
activated.
• When multiple PIDs are armed, only the PID that is triggered first will display a
red cursor.
Green (Trigger Activation Reference Point) - When using triggers, green vertical
cursors are displayed in all PIDs (except the PID that was triggered) as reference to
the triggered PID activation point.
• When a trigger is activated the displayed red and green cursors are all vertically
aligned in the graphed data to show the relationship of the trigger point in all
PIDs.