Scanner Viewing and Saving Data
40
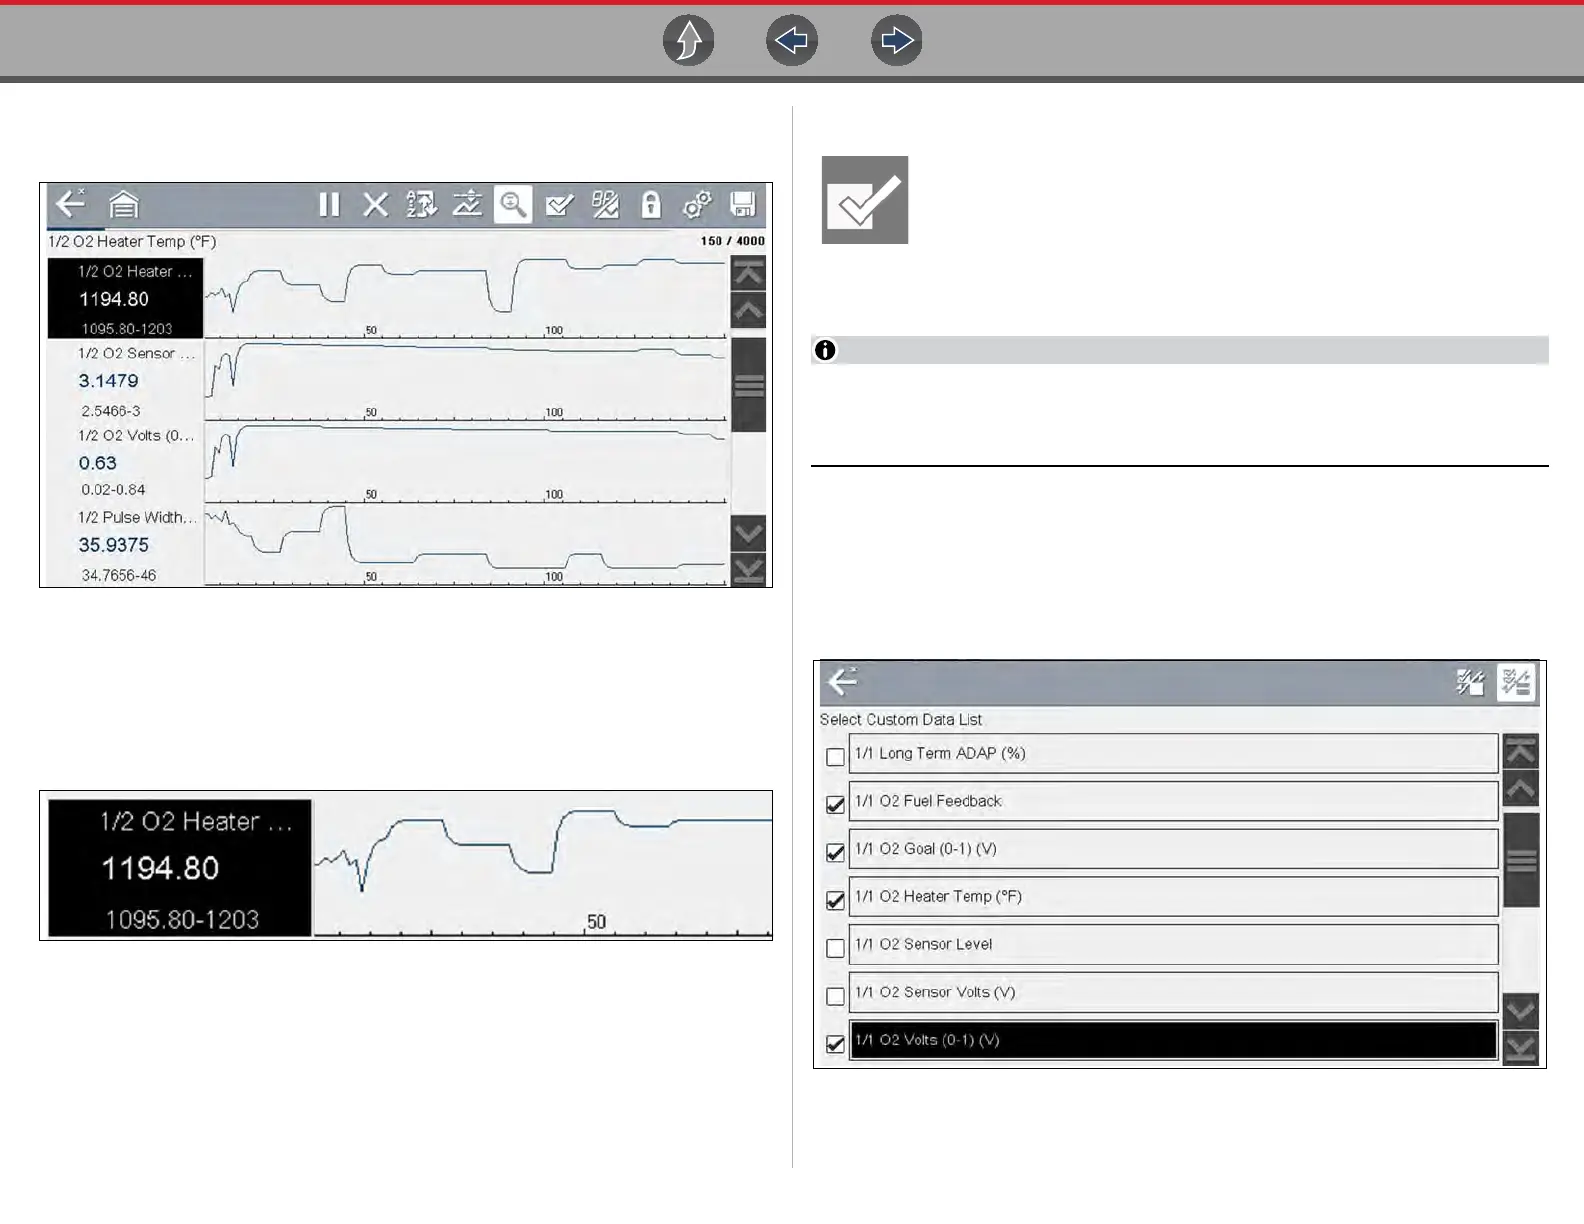
The 1, 2, and 4 Graph views divide the screen horizontally to simultaneously display
data graphs for the indicated number of parameters (Figure 6-20).
Figure 6-20 Four graph view
In graph view the text block (Figure 6-21) to the left of the graph displays:
• Top - PID description
• Middle - Current value or state
• Bottom - Active minimum and maximum values
Figure 6-21
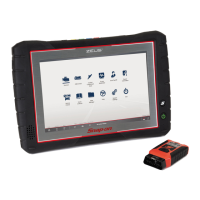
6.4.7 Selecting PIDs to Display (custom display)
The Custom Data List icon on the toolbar is used to select which PIDs
to display. Minimizing the number of PIDS displayed allows you to focus
on any suspicious or symptom-specific data parameters. You can add or
remove most PIDs from the list, as certain vital PIDs may not be
removed. These appear in gray at the top of the list along with a lock icon, and they
cannot be selected.
Limiting the number of parameters that display to those that apply to a
particular situation results in a faster data refresh rate, and reduces the
amount of memory used for saved files.
z To create a custom data list:
1. Select the Custom Data List icon on the toolbar.
The data selection screen displays (Figure 6-22) and selection icons appear.
Check marks to the left of the parameter description indicate which parameters
are selected for display.
Figure 6-22 Data custom PID selection