Scanner Viewing and Saving Data
39
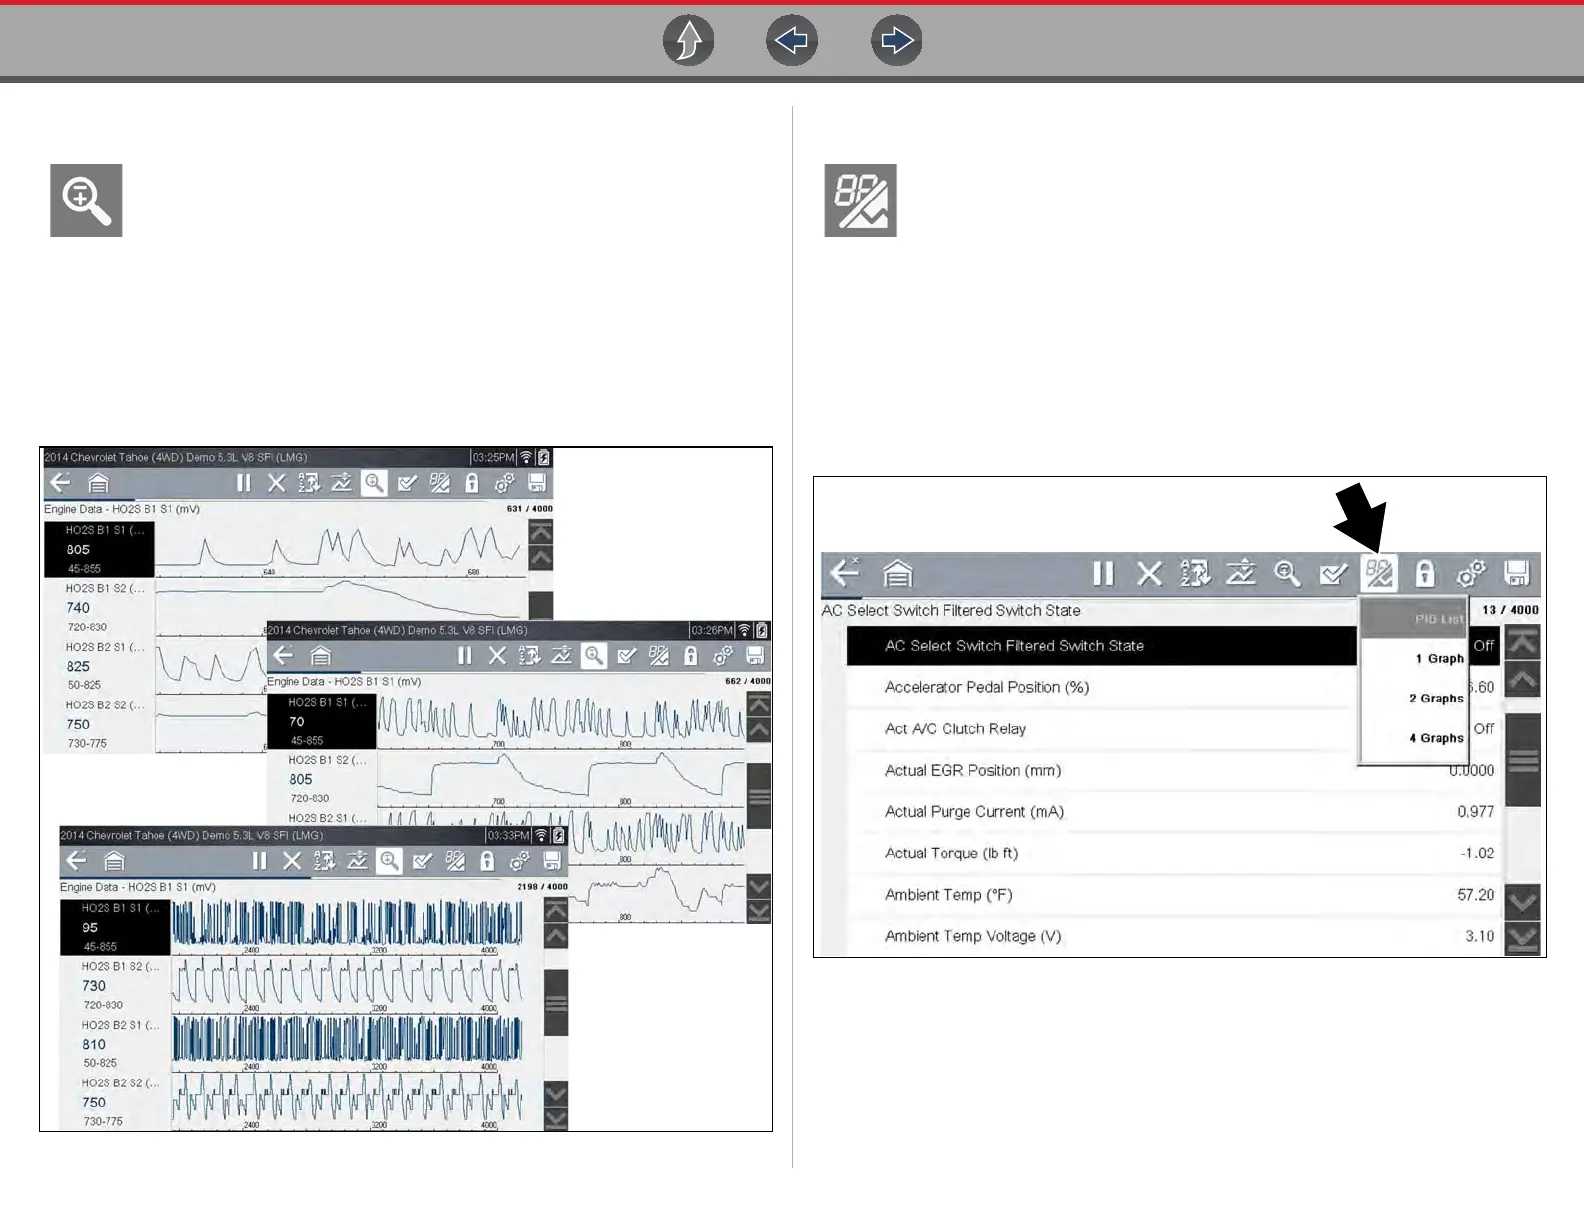
6.4.5 Using Zoom
The zoom function allows you to change the magnification level of the
graphed data during data collection and review. Changing magnification
levels allows you to compress or expand the displayed data to quickly
find glitches, or signal losses.
When the Zoom icon is selected the dropdown menu allows you to select the
display magnification level from a range of -2X to +8X. The "Zoom Out" option
displays up to half of the maximum amount of data that can be collected, on one
screen. The default magnification level is 1x.
Examples: Top (+4X), Middle (1X), Bottom (Zoom Out)
Figure 6-18 Zoom examples
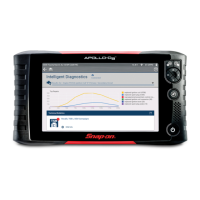
6.4.6 Changing Data Views - PID List / Graphs
Selecting the View icon (Figure 6-19) opens a drop-down menu of
viewing options:
• PID List
• 1 Graph
• 2 Graphs
• 4 Graphs
The PID List view is a 2-column display with the name of the parameters in the left
column and their current values in the right column (Figure 6-19).
Figure 6-19 PID List view