Operation
SPECTRO XEPOS — 19.01.2017 — 23
5 Operation
5.1 Displays
5.1.1 Screen – Routine dialog
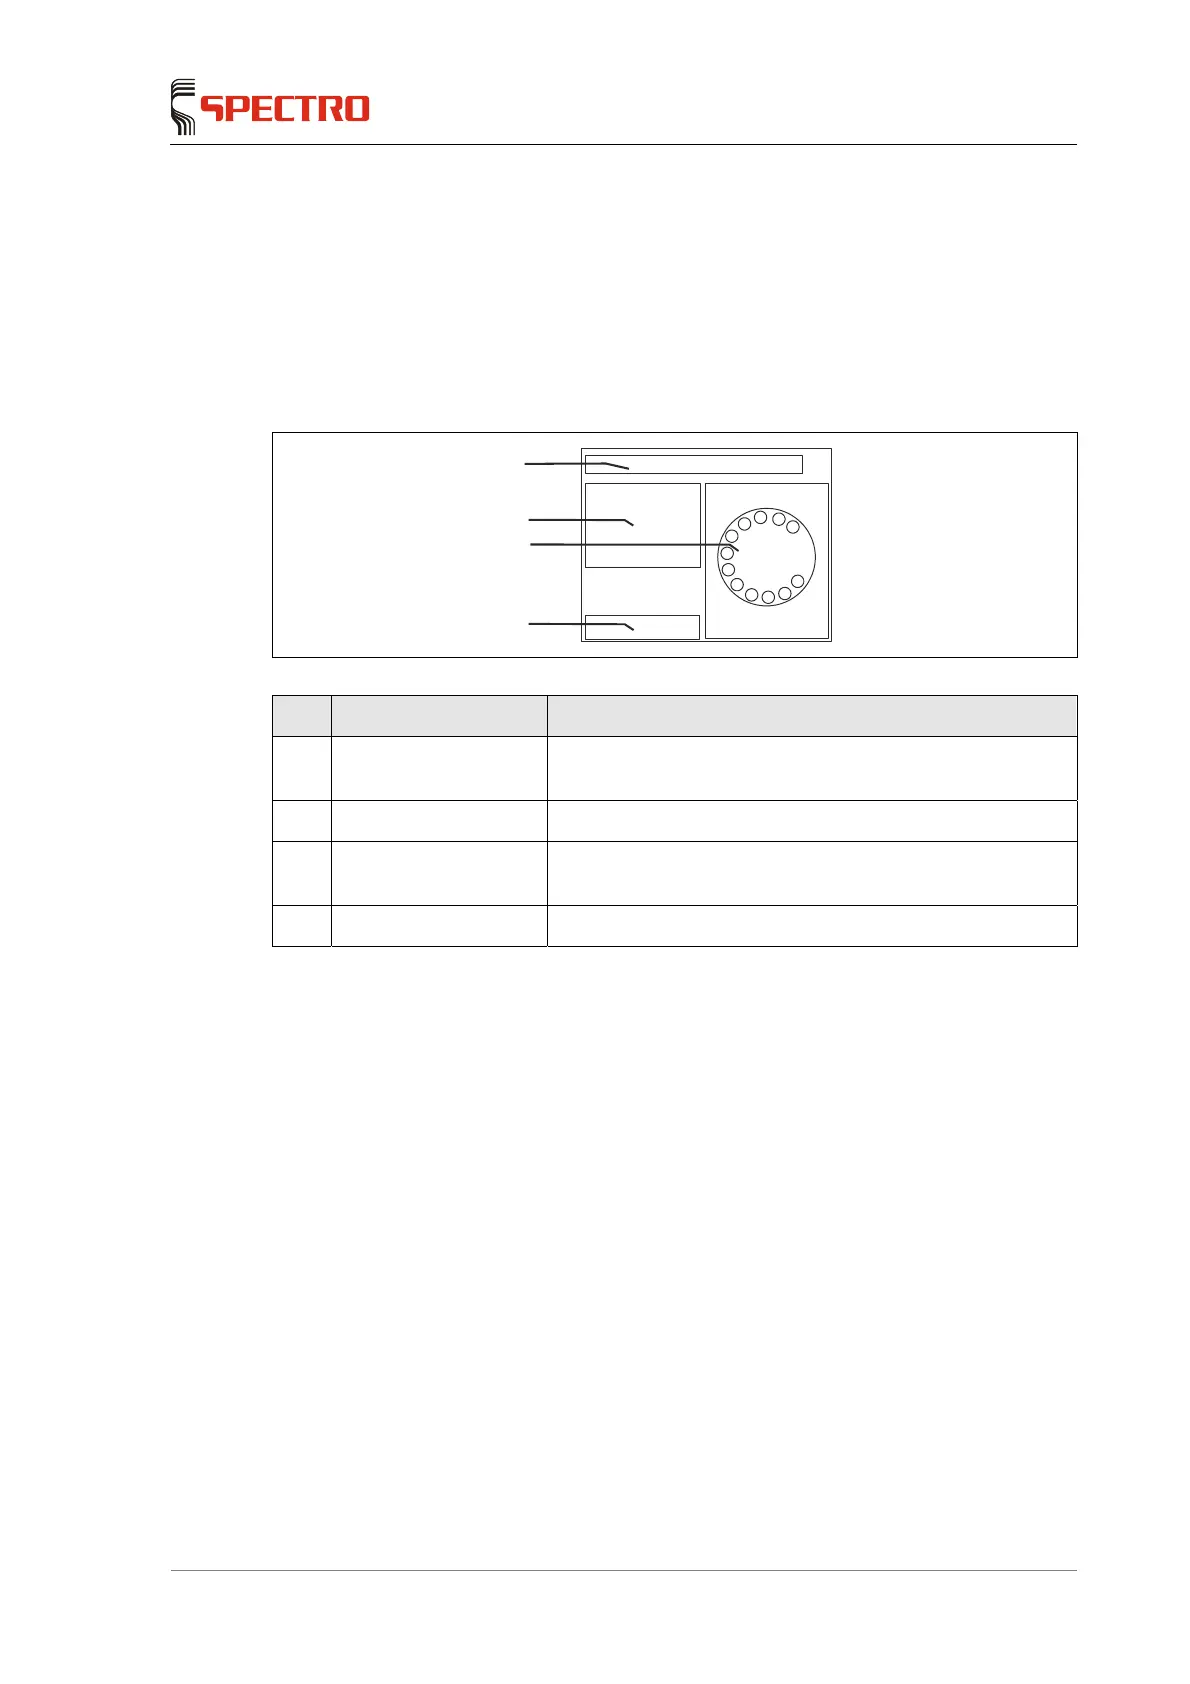
Fig. 11
No. Display Function
1 Status line Display for information from the program and the
instrument
2 Sample data table Input fields for sample data
3 Sample
tray/spectrum/result
Display of the sample position, the spectrum, and the
results of the analyses
4 Buttons Buttons for controlling the measurements
3
4
2
1