81307063I
EN
29
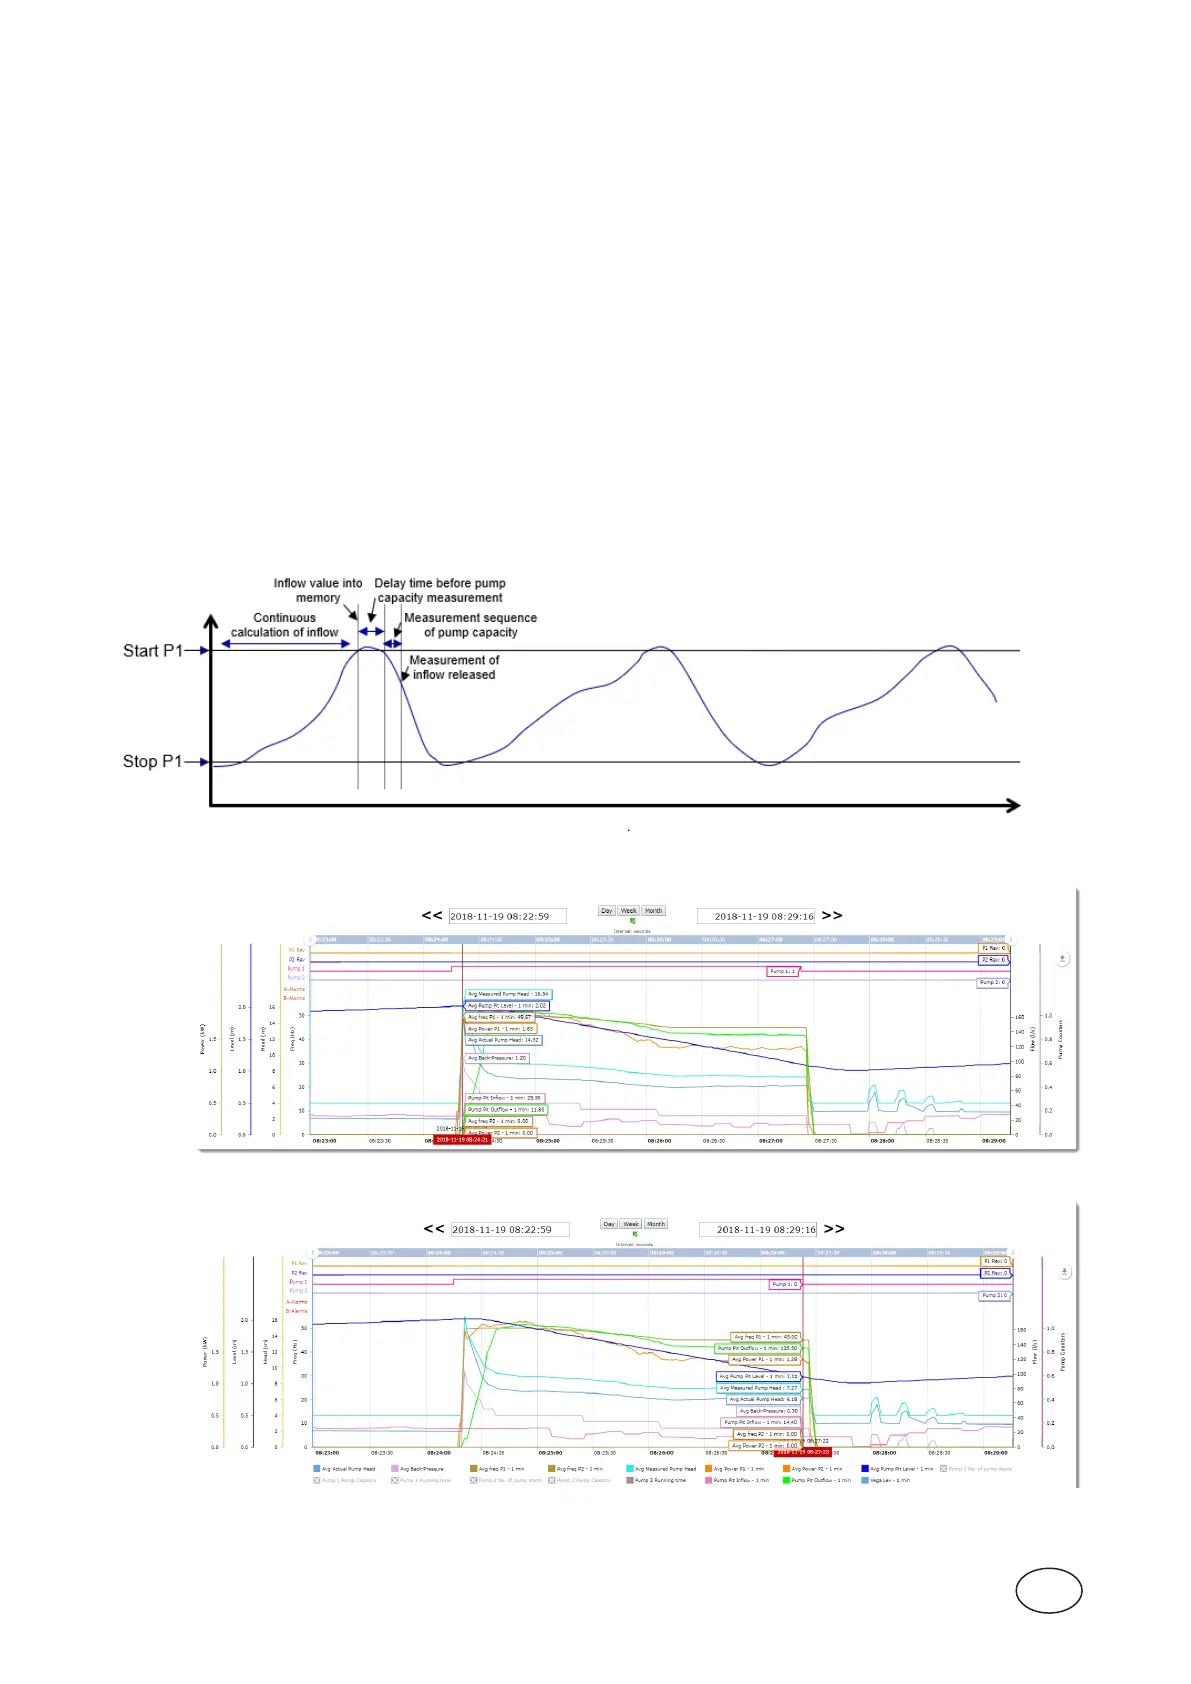
Example of calculation cycle:
1. Nopumpisrunning,levelincreasingduetoinowthatisthencalculatedbasedonthearea/levelandtime
settings.
2. Start level reached.
3. Currentinowstored.
4. Timedelaybeforepumpcapacitymeasurement,thistoenabletheowtopickupspeeddependingonsize
ofpit,pump,headandcollectionnetworkdesign.
5. Measurespeedoflevelreductionduringapresettimetoapumpcapacityvalueisnowobtained.
6. Thiscapacityvalueisnowadjustedtothepumpcurve(ifentered).
7. Releasetheinowcalculation.
8. Theinowisnowafunctionofthepumpcapacityandenteredpumpcurve.
9. Ifyetapumpstartstheoutowandinowisthenalsoadjustedaccordingtothesystemcurve.
10. Ifapumpisrunningandthereisastablelevelreading,thiswouldindicatethattheinowmatchesthe
outow.
11. Ifthelevelincreasesitindicatesthattheinowishigherthanthepumpcapacity.
Chart example is based on a full run cycle for P1.
Charts like these are available through the Sulzer AquaWeb tool.
 Loading...