81307063I
EN
32
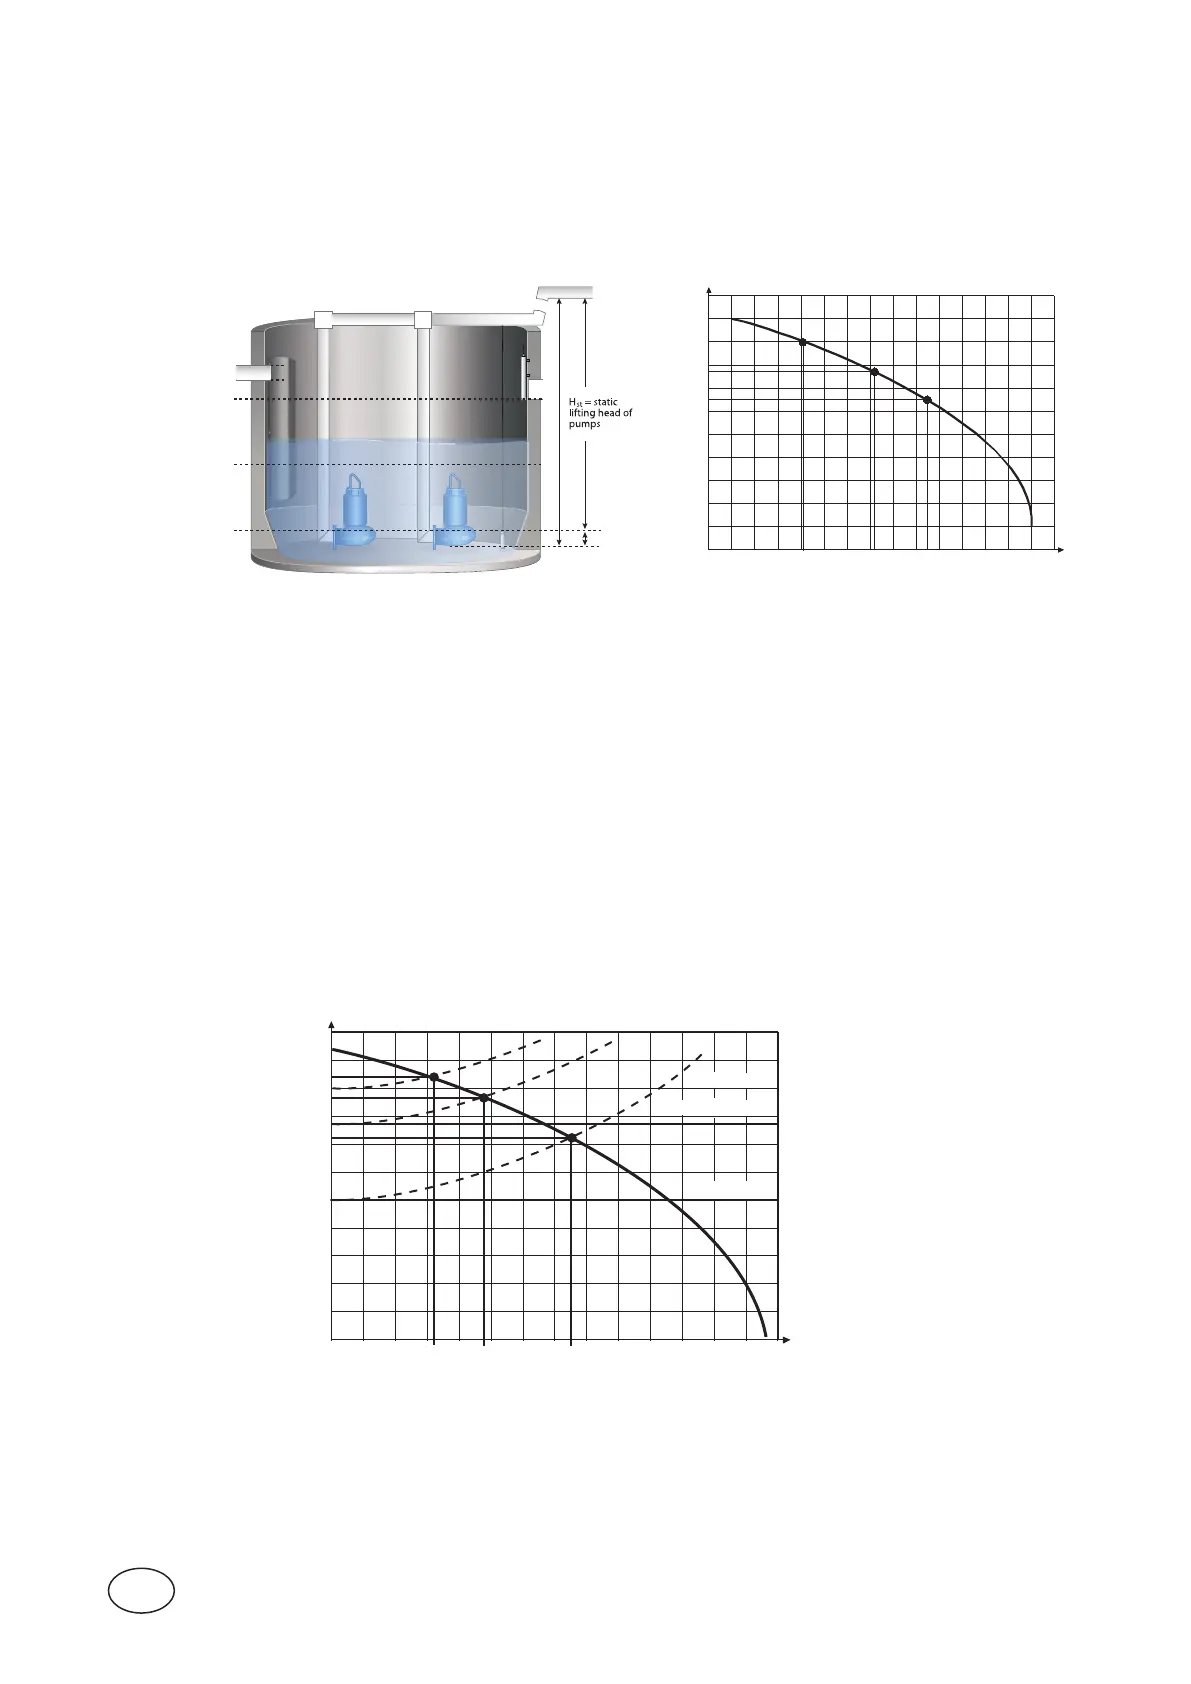
3.2.2 Pump curve
Theoutowofthepitiscalculatedwhenthepumpsarerunning.Itisbasedonthecapacityforthepumps
andisaccumulatedtoapumpedvolume.Ifaleveldierenceinthepit,duringpumping,giveschangesinthe
pumpcapacityaccordingtothepumpcurve,thisshouldbesetinthePC441.Theoutowwillinthiscasebe
compensatedwiththeactuallevelinthepitaccordingtothepumpcurve,whichgivesamoreaccurateac-
cumulated volume.
Figure 3-5
0 2 4 6 8 10
12
14 16 18 20 22 24 26 28 30 l/s
0
2
4
6
8
10
12
14
16
18
20
22
Head of pump
mWp.
H
M
L
Actualheadofpump=Totalheadofpump-actuallevel
Abovepumpcurve gure 3-5givesfollowingowsandsettings.
In menu Pump 1-4 > Pump Curve.
(L) Point 1 Hmax tot. head 18.0 m (ft.) Point 1 ow 8.2 l/s (GPM)
(M) Point 2 Hmid tot. head 15.5 m (ft.) Point 2 ow 14.4 l/s (GPM)
(H) Point 3 Hmin tot. head 13.0 m (ft.) Point 3 ow 19.0 l/s (GPM)
IfsensorismountedaccordingtoEx1(Sensor0-level=Pumpoutlet)setparameterTotal head sensor zero=
18 m.
If sensor is mounted according to figure 3-5, 0.4 m below pump outlet set parameter Total head sen-
sor zero = 18 + 0.4 = 18.4 m.
NOTE! Ifpossibleaddthedynamichead(pipelosses)tothetotalheadforthepumps;thismayincreasetheaccuracy
oftheevaluationstremendously,especiallywhenfrictionallossesofthepipesarerelativelyhigh.
AsasimpleapproachyoucanndtheheadsacquaintedtothemeasuredowsbyusingtheQHcurveofthe
pumpperformancechart.ThisperformancechartyoucanobtainfromABSELsoftware.
Figure 3-6 Pumpcurvewithdynamicheadadded
Lifting elevation = 18 m
Mid level 2.5 m from
lowest level
M = 18 m - 2.5 m = 15.5 m
Overflow at 5 m from
lowest level
H = 18 m - 5 m = 13 m
Lowest level 0 m
L = 18 m - 0 m = 18
m
Diff.
0.4 m
10
15.5
18
H max
H mid
H
M
L
H min
Q
Static head 10m
Static head 15.5m
Static head 18m
Q1 Q2 Q3