CyFlow™ Cube 6 V2m | Operating Manual | February 2020
Gating
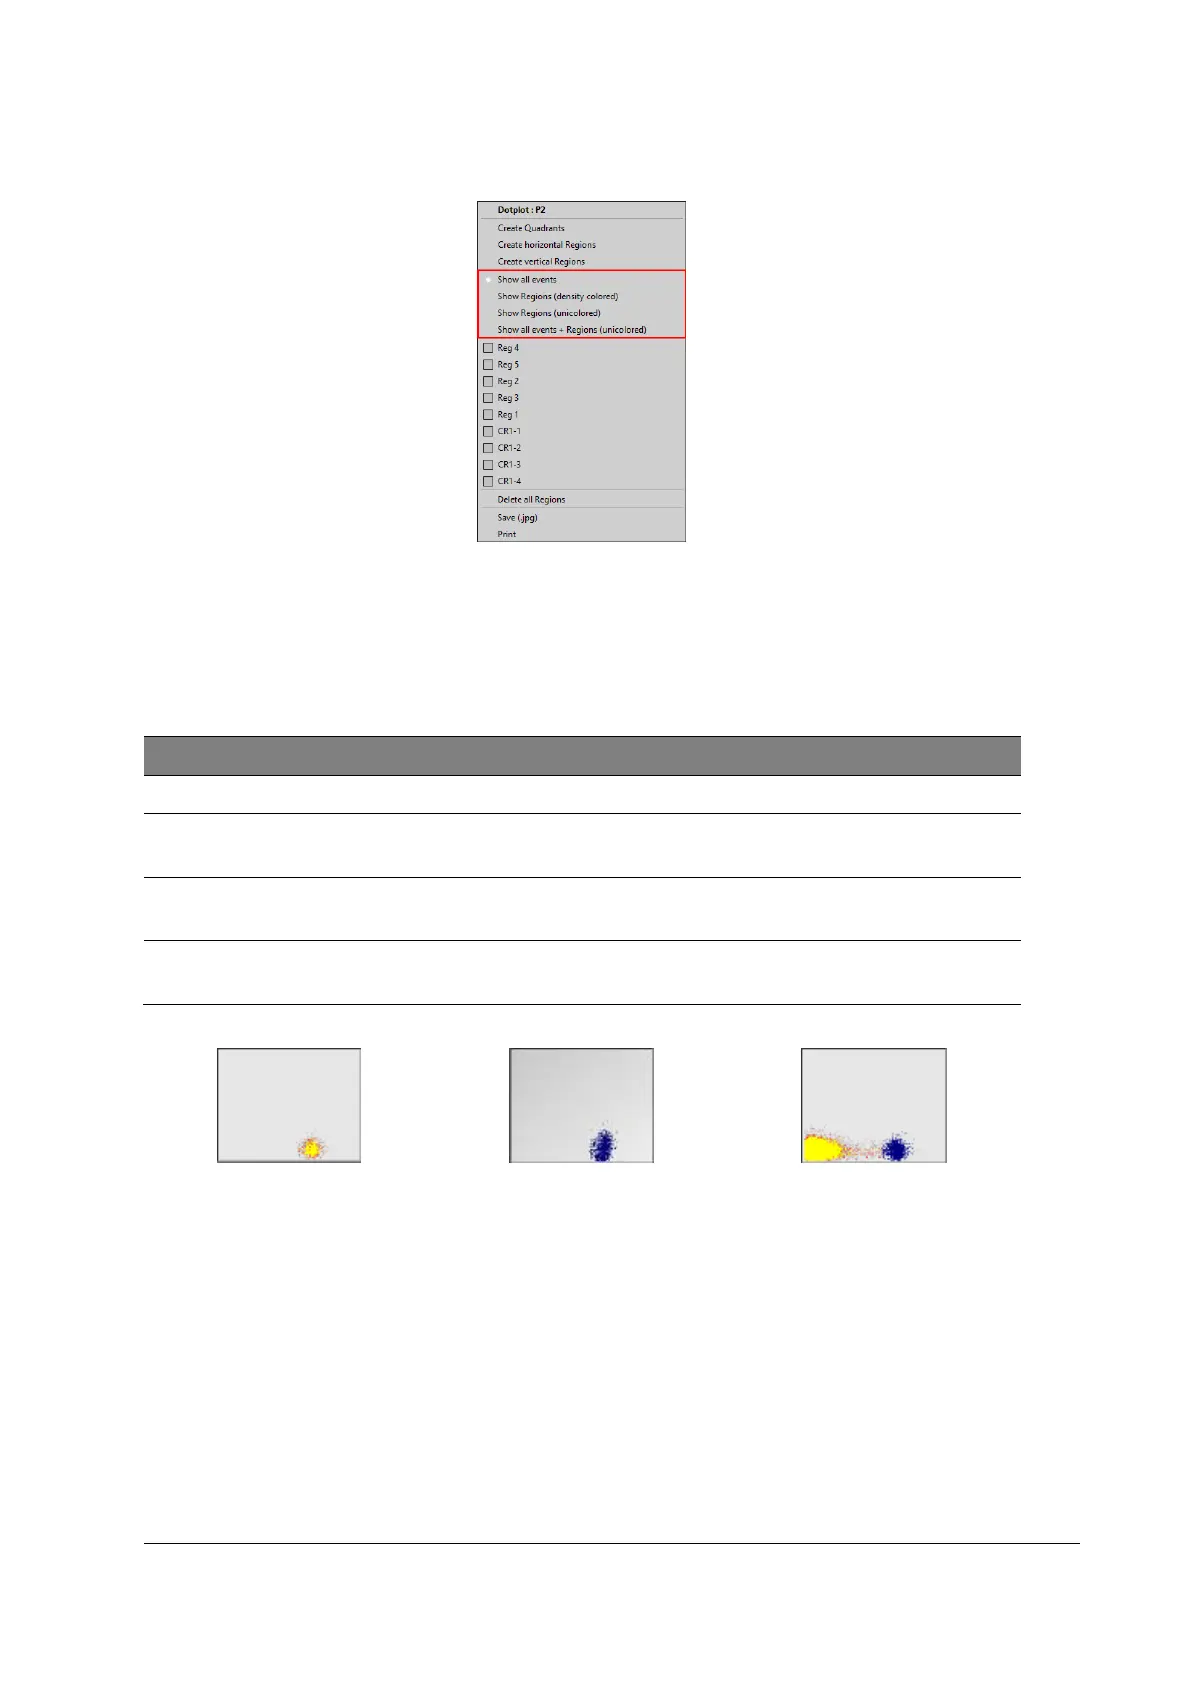
Figure 26: display options
Procedure
1. Right-click in a histogram or Dot Plot (outside of a region).
2. Select any existing region (Reg 1-Reg x) which is labelled with [Color gating on].
3. Choose display option.
Displays all events in pseudo 3D color
Show Regions
(density colored)
Displays events in the selected region(s) in pseudo 3D color
Show Regions
(unicolored)
Displays the events in the selected region(s) in the region color
Show all events +
Regions (unicolored)
Displays the events in the selected region(s) in color together
with all events in pseudo 3D color
Figure 27: Show Regions (density
colored)
Figure 28: Show Regions (unicolored)
Figure 29: Show all events + Regions
(unicolored)