Operating Instructions
2–22
1720/1721
MG
Q
B
CY
G
YL
R
180°
U
0°
V
90°
–V BURST
225°
270°
+V BURST
135°
cy
b
mg
r
yl
g
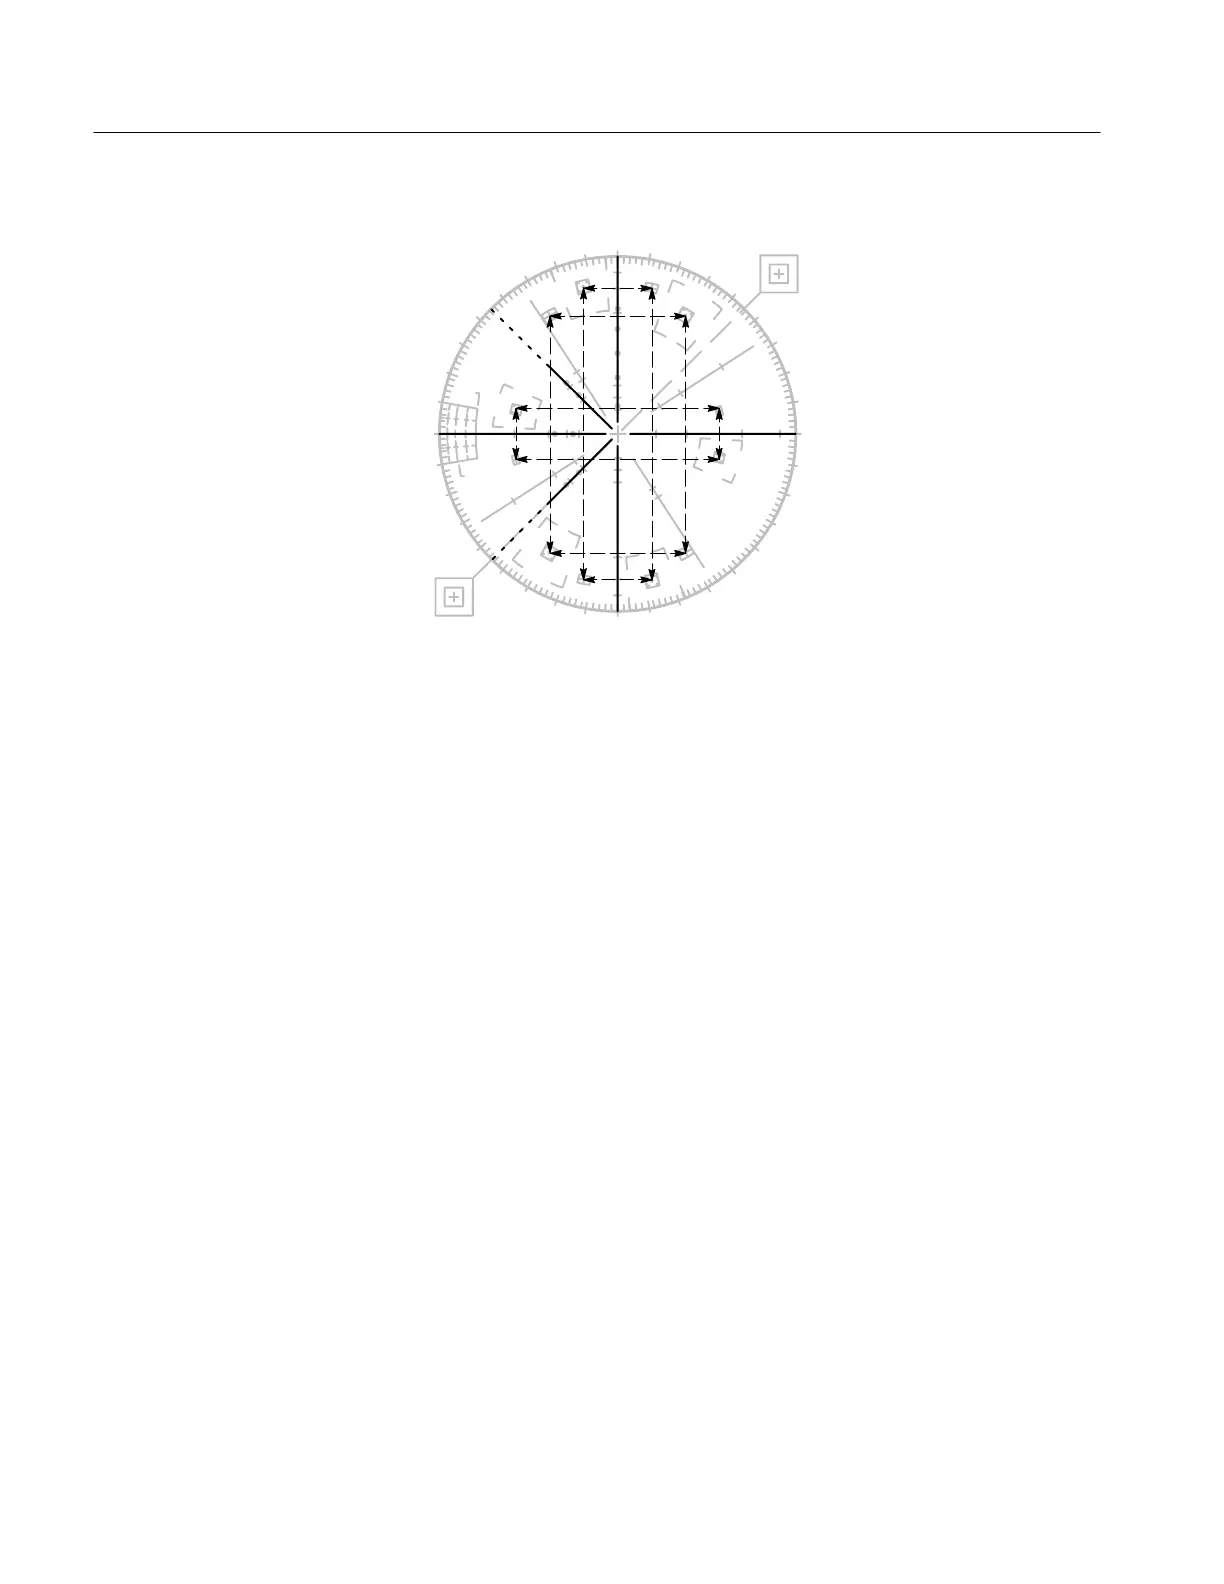
Figure 2-16: Simulation of a 1721 graticule showing the relationship between
amplitudes on the U and V axes and the locations of the color vector targets.
The horizontal and vertical axes of the vector graticule contain markings for
checking Vector Mode bandwidth. A subcarrier frequency sine wave whose
amplitude places it on the outer compass rose is used as a reference. When the
frequency is changed the diameter of the circle should reduce. At a point equal
to 70% of full amplitude (3 dB), there are gaps in the horizontal and vertical
axes. This calibration aid makes it possible to check the –3 dB points of the
demodulator output amplifiers.
The two major distortions that affect the signal are differential gain and
differential phase. They are chrominance non-linearities caused by luminance
amplitude variations. Both can be measured on the vectorscope. Differential
gain is a change in color subcarrier amplitude due to a change in the luminance
signal while the hue of the original signal is held constant. In the reproduced
picture, saturation will be distorted in the areas between the light and dark
portions of the scene. Differential phase is a phase change of the chrominance
signal, caused by a change in the luminance signal, while the original chromi-
nance signal amplitude is held constant. In the reproduced picture, the hue will
vary with the scene brightness. Differential gain and differential phase may
occur separately or together.
Differential Gain and
Phase Measurements