26 Working in the Graph View
1. Open the original data set you want to see in two graph windows.
2. Click
Edit > Page Layout > Selected Layout.
Handheld: Press ~, and then select Page Layout > Select Layout.
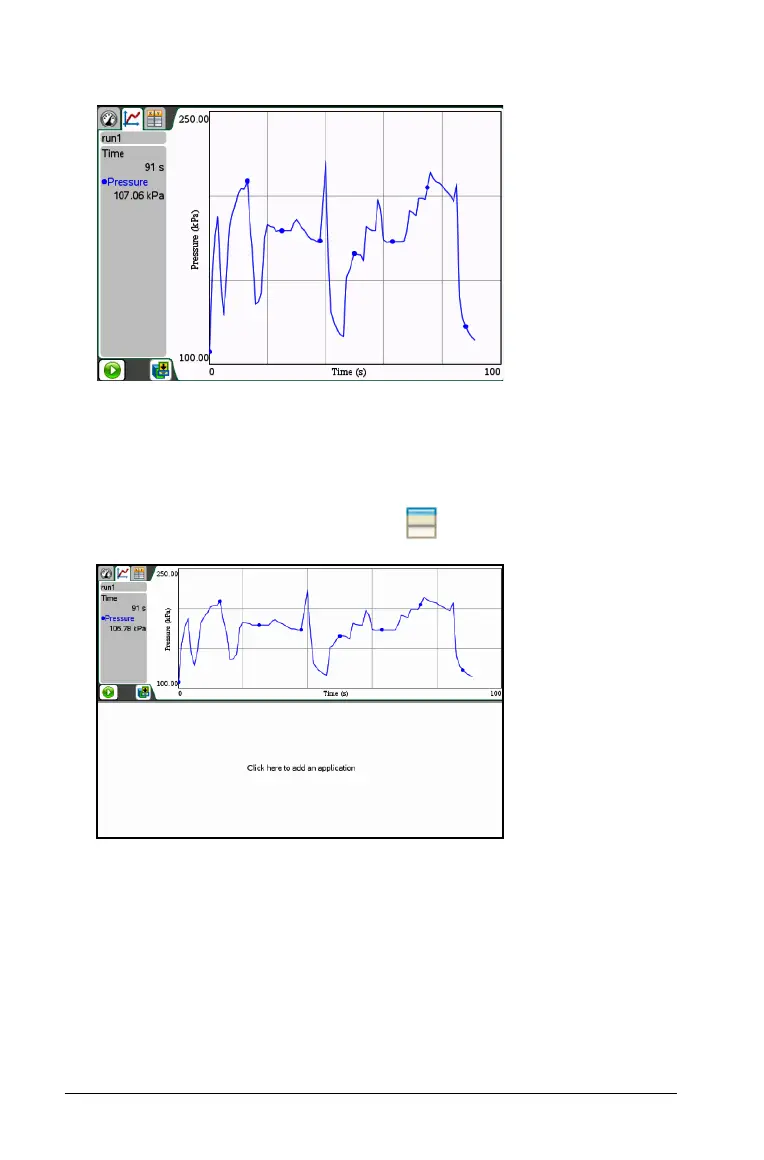
3. Select the type of page layout you want to use.
In this example, the top and bottom page symbol was selected.
4. Select “Click here to add an application.”
Handheld: Press b.
5. Select
Add Vernier DataQuest.
The Vernier DataQuest™ application is added to the second view.
This example shows two Vernier DataQuest™ applications running at
the same time.

 Loading...


