54 Analyzing Data in Graph View
To find the slope:
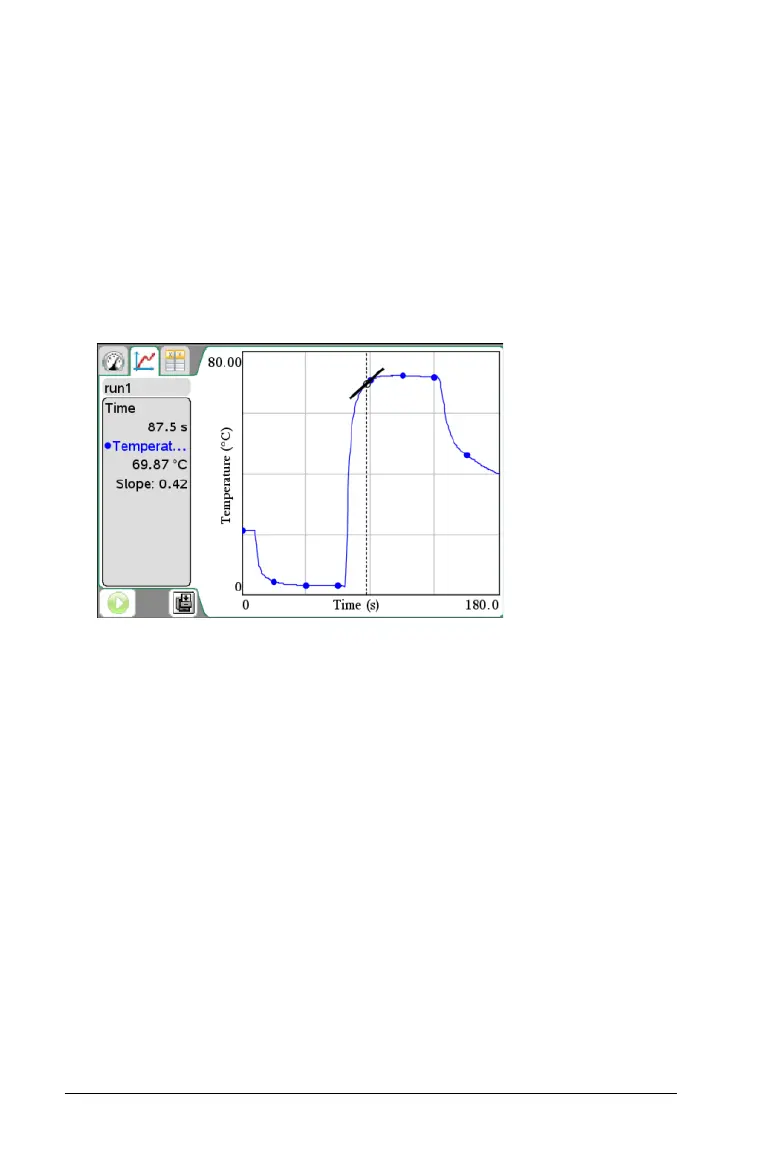
1. Click
Analyze > Tangent.
A check mark appears in the menu next to the option.
2. Click the graph.
The examine indicator is drawn to the nearest data point.
The values of the plotted data are shown in the View details area and
the All Details for Graph dialog box.
You can move the examine line by moving the cursor with the arrow
keys or clicking on another data point.
For information on clearing the Integral analysis, see Removing
Analysis Options.
Finding the Area Under a Data Plot
Use Integral to determine the area under a data plot. You can find the
area under all of the data or a selected region of the data.
To find the area under a data plot:
1. Leave the graph unselected to examine all the data, or select a range
to examine a specific area.
2. Click Analyze > Integral.
3. Select the plotted column name if you have more than a single
column.
The data plot area is displayed in the View Details area.

 Loading...


