Working with Advanced Analysis Features 75
1. Click Analyze > Draw Prediction > Draw.
2. Move the cursor over the graph, and then click each area in which
you want to place a point.
3. Press Esc to release the drawing tool.
Handheld: Press d.
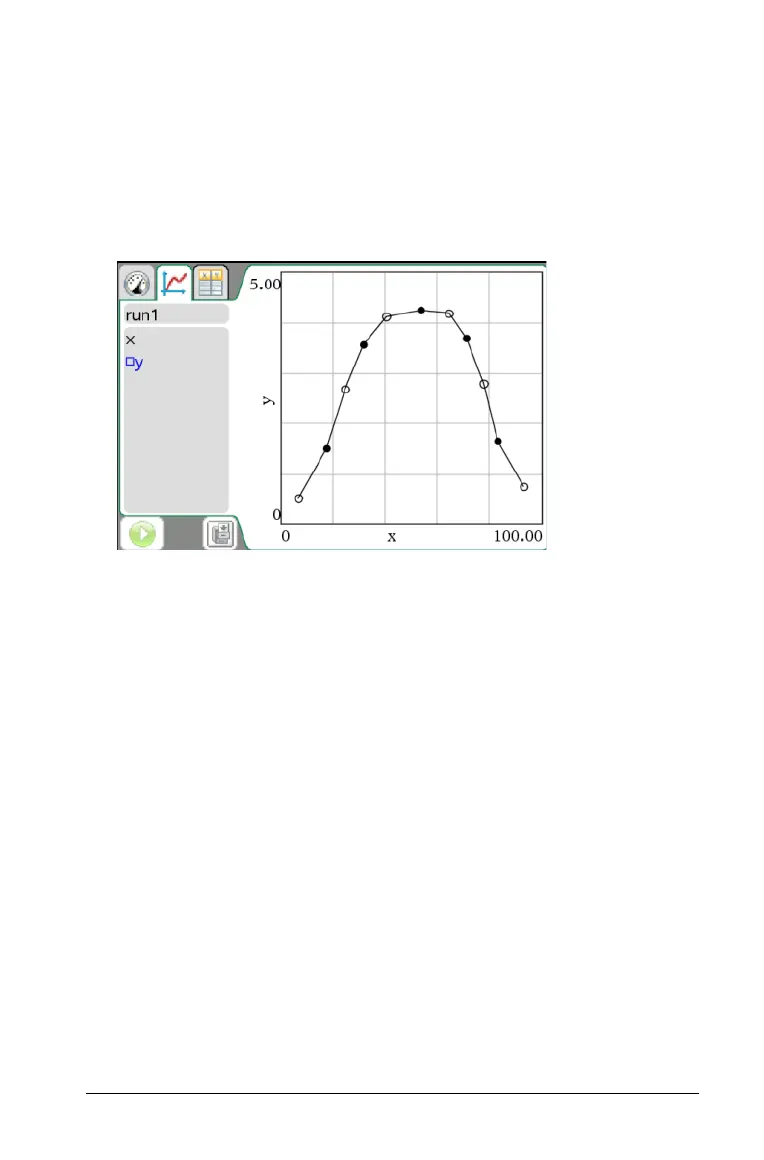
The following image is an example of a drawn prediction.
Clearing the Prediction
To clear the drawn prediction:
Click
Analyze > Draw Prediction > Clear.
Using Motion Match
Use this option to create a randomly generated plot when creating
position versus time or velocity versus time graphs.
This feature is only available when using a motion detector like the
CBR 2™ sensor or the Go!Motion® sensor.
Generating a Motion Match Plot
To generate a plot:
1. Attach the motion detector.
2. Click
View > Graph.
3. Click Analyze > Motion Match.
4. Select one of the following options:
• New Position Match. Generates a random position plot.

 Loading...


