Analyzing Data in Graph View 53
3. Drag the area to the right to increase the size, and then click to set
the size.
Drag the area to the left to decrease the size, and then click to set the
size.
Interpolating the Value Between Two Data Points
Use Interpolate to estimate the value between two data points and to
determine the value of a Curve Fit between and beyond these data
points. You can find the area under all of the data or a selected region of
the data.
The examine line moves from data point to data point. When Interpolate
is on, the examine line moves between and beyond data points.
To use Interpolate:
1. Click
Analyze > Interpolate.
A check mark appears in the menu next to the option.
2. Click the graph.
The examine indicator is drawn to the nearest data point.
The values of the plotted data are shown in the View details area and
the All Details for Graph dialog box.
You can shift the examine line by moving the cursor with the arrow
keys or by clicking on another data point.
For information on clearing the Integral analysis, see Removing
Analysis Options.
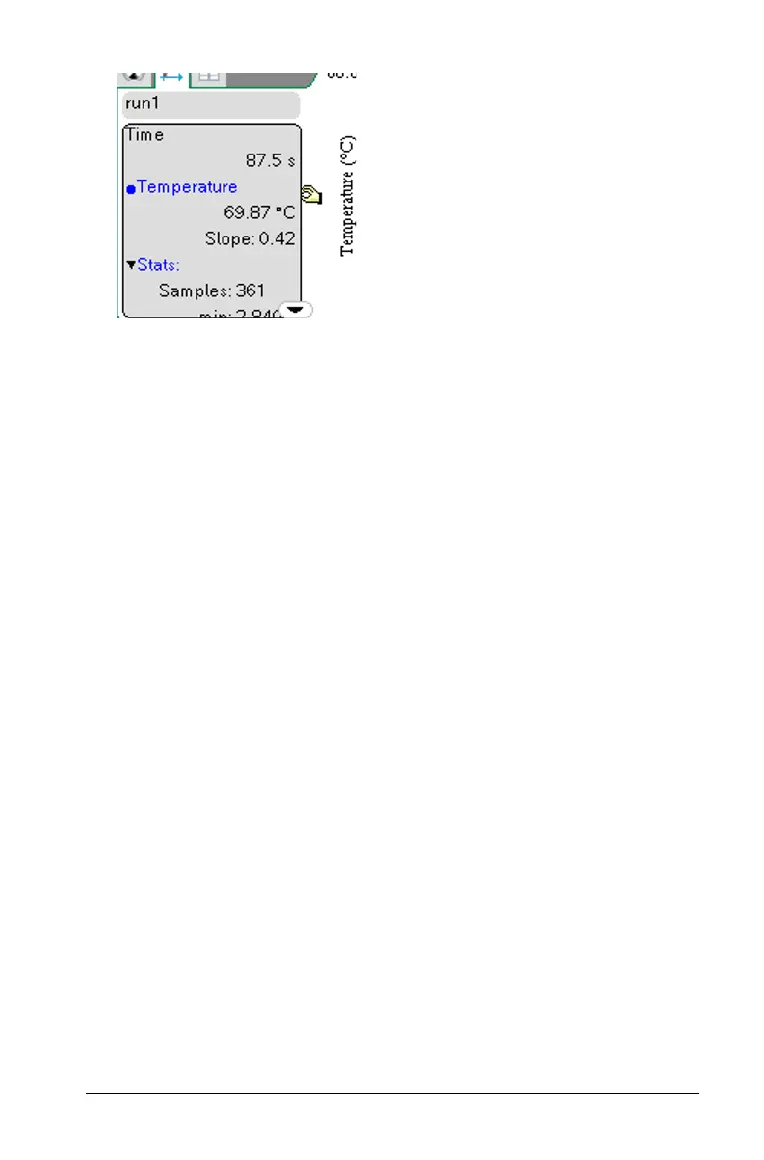
Finding the Slope
Tangent displays a measure of the rate at which the data is changing at
the point you are examining. The value is labeled “Slope.”

 Loading...


