74 Working with Advanced Analysis Features
The Vernier DataQuest™ application can determine a numeric derivative
of a list of data with respect to another list of data. The data can be
collected using sensors, input manually, or linked from other
applications. The numerical derivative is found using a calculated
column.
To determine the numerical 1st derivative of List B with respect to List A,
enter the following expression in the Column Options dialog:
derivative(B,A,1,0) or derivative(B,A,1,1)
To determine the numerical 2nd derivative of List B with respect to List A,
enter the following express:
derivative(B,A,2,0) or derivative (B,A,2,1)
The last parameter is either 0 or 1 depending on the method you are
using. When it is 0, a weighted average is used. When it is 1, a time
shifted derivative method is used.
Note: The first derivative calculation (weighted average) is what the
Tangent tool uses to display the slope at a data point when examining
data. (Analyze > Tangent).
Note: The derivative calculation is completely row based. It is
recommended that your List A data be sorted in ascending order.
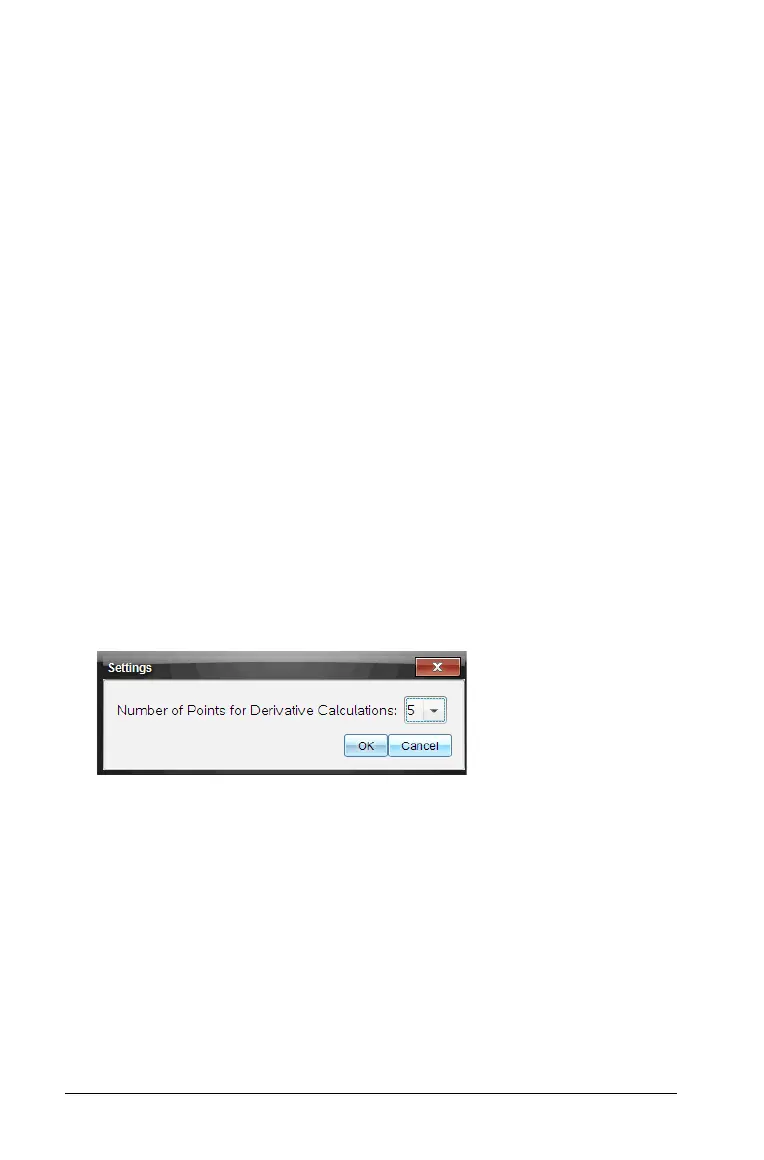
1. Click
Options > Derivative Settings.
The Settings dialog box opens.
2. Select the number of points from the drop-down list.
3. Click
OK.
Drawing and Clearing a Predictive Plot
You can add points to the graph to draw a prediction and you can
remove the prediction.
Drawing a Predictive Outcome
Use this option to add points to the graph to predict the outcome of an
experiment.
To draw the prediction:
 Loading...


