Using the Sensors and Data with Other Applications 83
You can now work with the data in the current application.
Analyzing Data in the Data & Statistics
Application
When you open existing data in the Data & Statistics application, the
data first displays as a Dot Point graph. You must take additional steps to
organize the points.
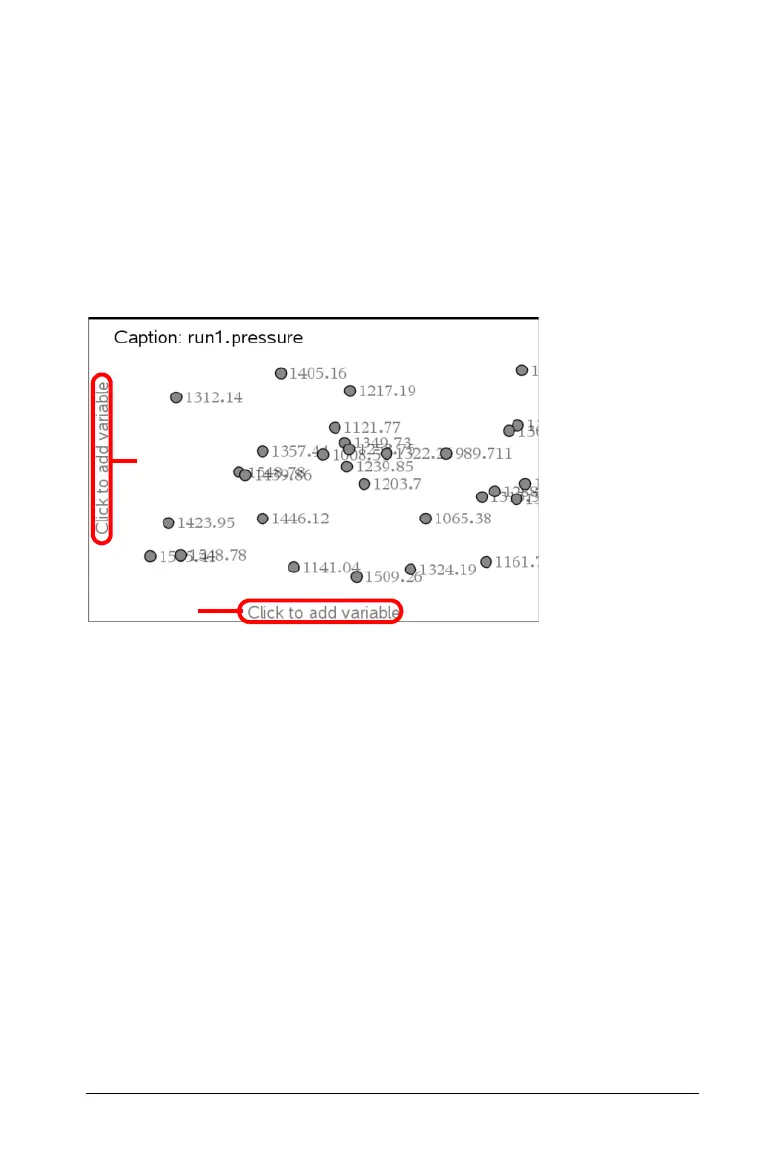
The following image is an example of existing data opened as a Dot
Point graph in the Data and Statistics application.
1. Open the document containing the data set in the Data & Statistics
application.
2. Click the text “Click to add variable” on the y-axis.
3. Select the variable.
4. Click the text “Click to add variable” on the x-axis.
5. Select the variable.
The data is replotted.

 Loading...


