Analyzing the Data in Table View 41
Analyzing the Data in Table View
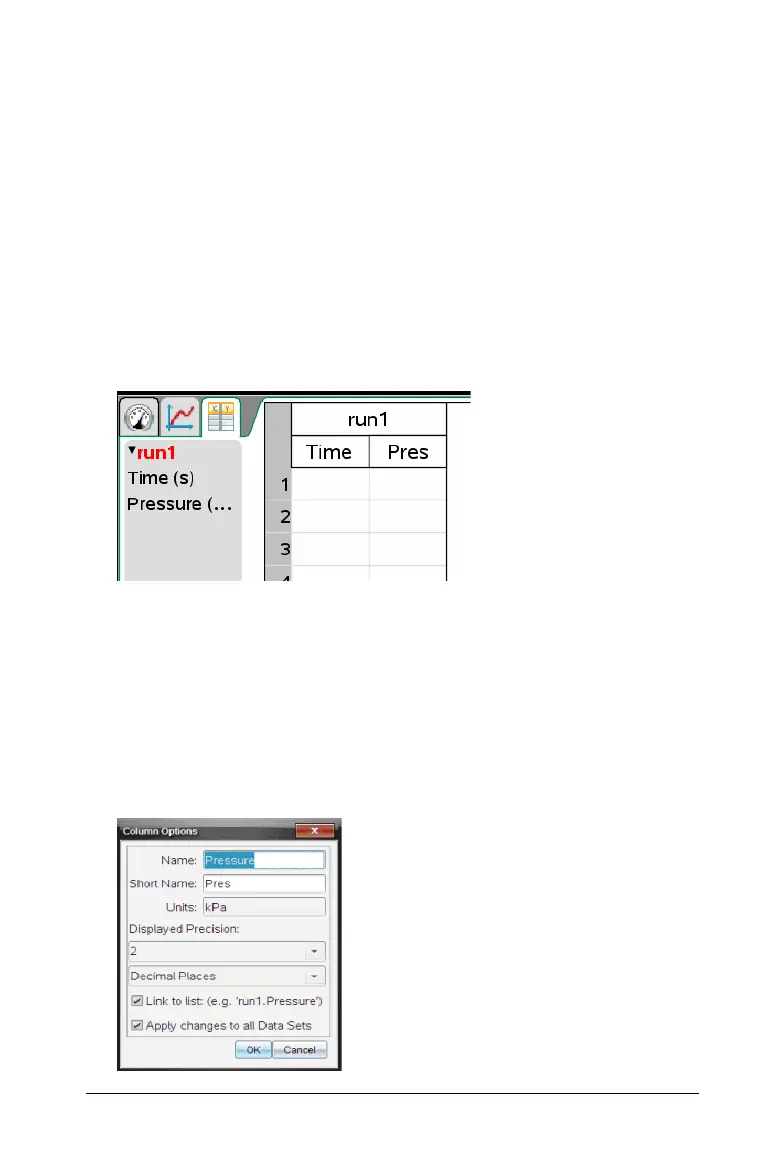
Table view provides another way to sort and view collected data.
Defining Column Options
You can name columns and define the decimal points and the precision
you want to use. To define the columns:
1. Click View > Table.
The Table view is displayed.
In this example, no data sets have been run and the Vernier Gas
Pressure Sensor is attached.
2. Click
Data > Column Options.
The Column Options menu opens.
Note: You can be in the Meter, Graph, or Table view and still click
these menu options. The results will still be visible.
3. Click the name of the column you want to define.
Note: Some of the fields may be populated but can be edited.
The Column Options dialog box opens.

 Loading...


