56 Analyzing Data in Graph View
5. Click OK.
For information on clearing the Statistics analysis, see Removing
Analysis Options.
Generating a Curve Fit
Use Curve Fit to find the best curve fit to match the data. Select all of the
data or a selected region of data. The curve is drawn on the graph.
To generate curve fit:
1. Leave the graph unselected to examine all the data, or select a range
to examine a specific area.
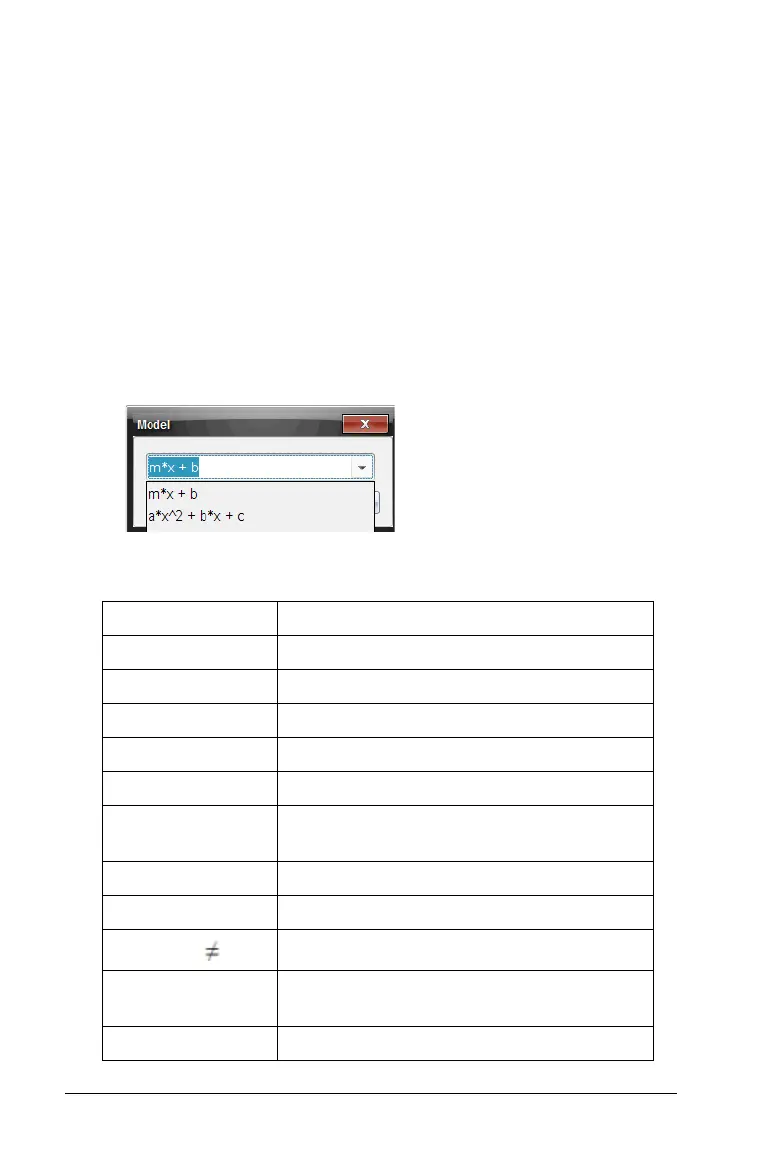
2. Click Analyze > Curve Fit.
The Model dialog box is displayed.
3. Select the curve fit option from the drop-down list.
Curve Fit option Calculated in the form:
Linear y = m*x + b
Quadratic y = a*x^2 + b*x + c
Cubic y=a*x^3+b*x^2+c*x+d
Quartic y = a*x^4 + b*x^3 + c*x^2 + d*x + e
Power (ax^b) y = a*x^b
Exponential
(ab^x)
y= a*b^x
Logarithmic y = a + b*ln(x)
Sinusoidal y = a*sin(b*x + c) + d
Logistic (d 0)
y = c/(1 + a*e^(-bx)) + d
Natural
Exponential
y = a*e^(-c*x)
Proportional y = a*x

 Loading...


