CTV-SVU01B-EN • Tracer AdaptiView Display Operations Guide 31
Data Graphs
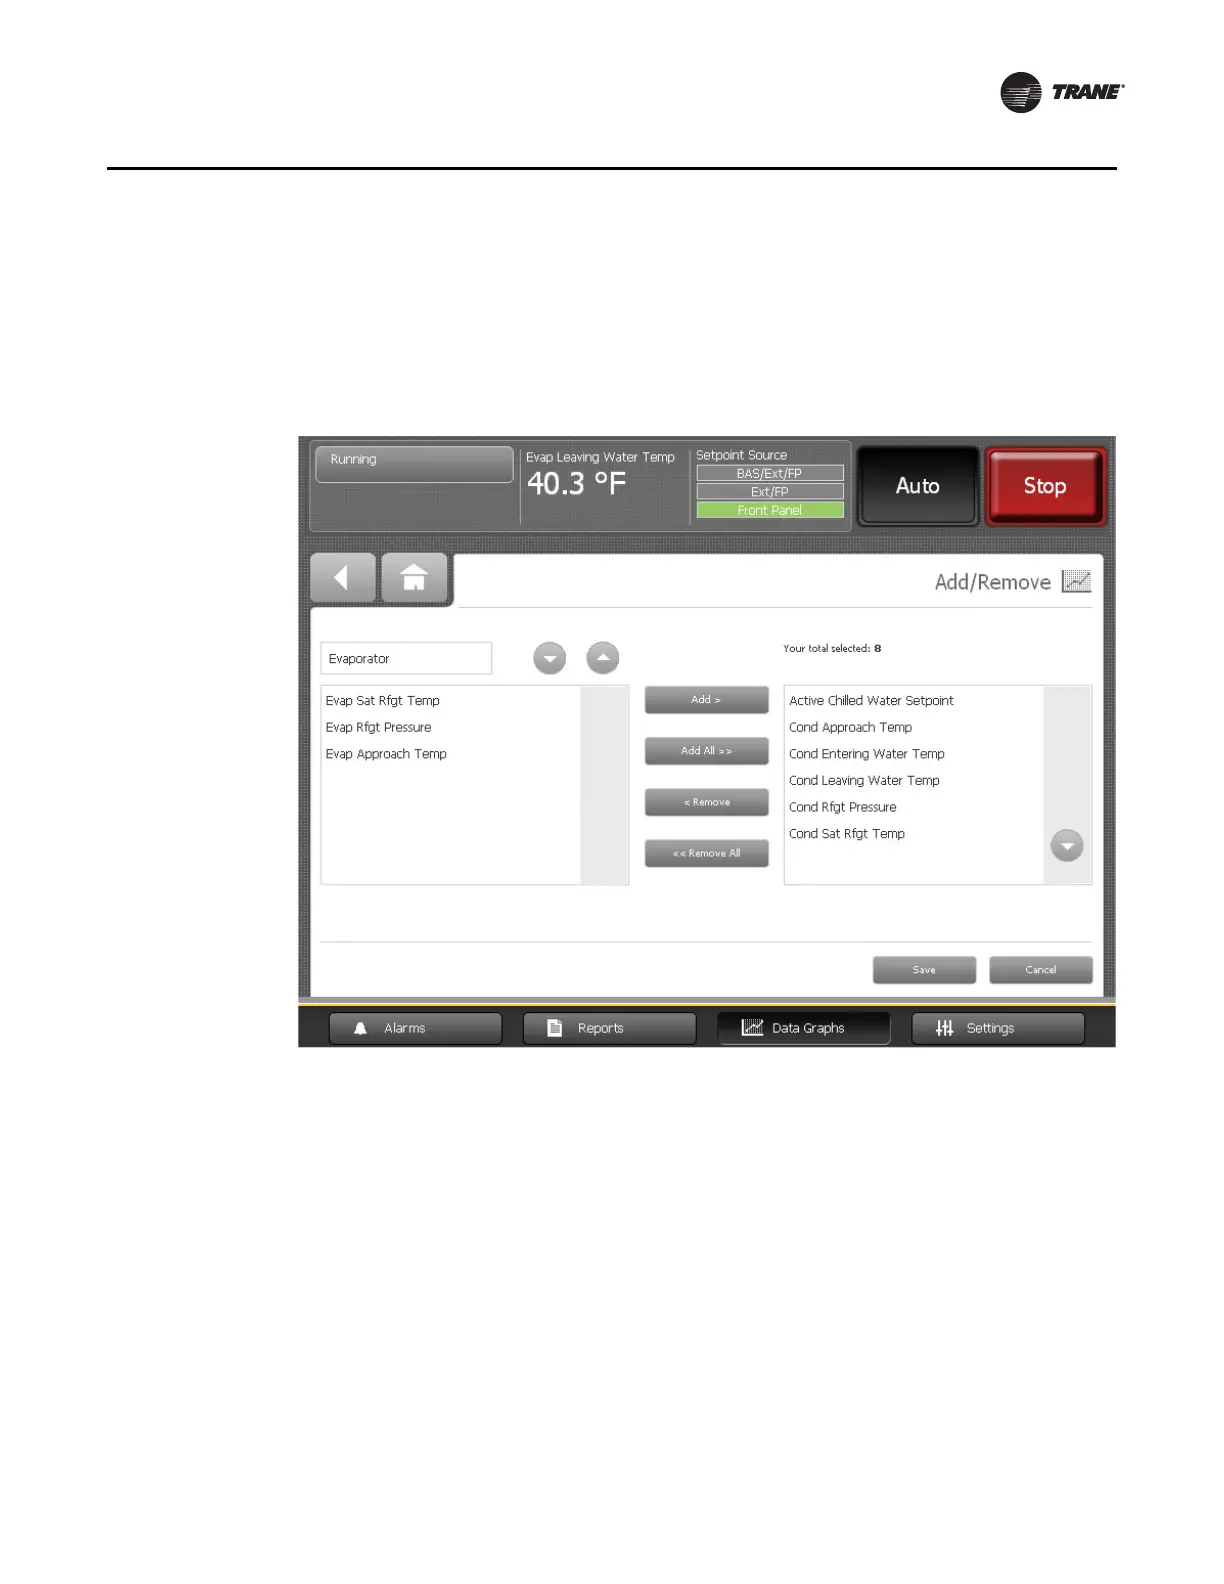
2. Touch the Add/Remove Data Points button at the bottom of the screen. The Add/
Remove screen appears (Figure 15, p. 31), pre-populated with data points from the
default data graph you chose.
Note: When you save this graph, a new custom graph is created; the default data
graph is not overwritten.
3. Touch the up/down arrows at the top of the left box on the Add/Remove screen to
scroll through a list of chiller components. The list of items in the box just below the
up/down arrows changes to correspond to the component choice. (For reference,
these items are also listed in “Appendix C: Data Graph Data Points,” p. 69).
4. To choose points to include in the custom data graph, you can do any of the following:
• To add one item at a time, touch the item in the left box. It responds by changing
to blue. Touch Add to move the selected item to the right box.
• To add all of the items in the left box to the right box, touch Add All.
• To remove one item at a time, touch the item in the right box. It responds by
changing to blue. Touch Remove to move the selected item to the left box.
• To remove all of the items in the right box to the left box, touch Remove All. A
confirmation screen appears, asking you to verify your request.
Figure 15. Add/Remove screen example
 Loading...