28 Tracer AdaptiView Display Operations Guide • CTV-SVU01B-EN
Data Graphs
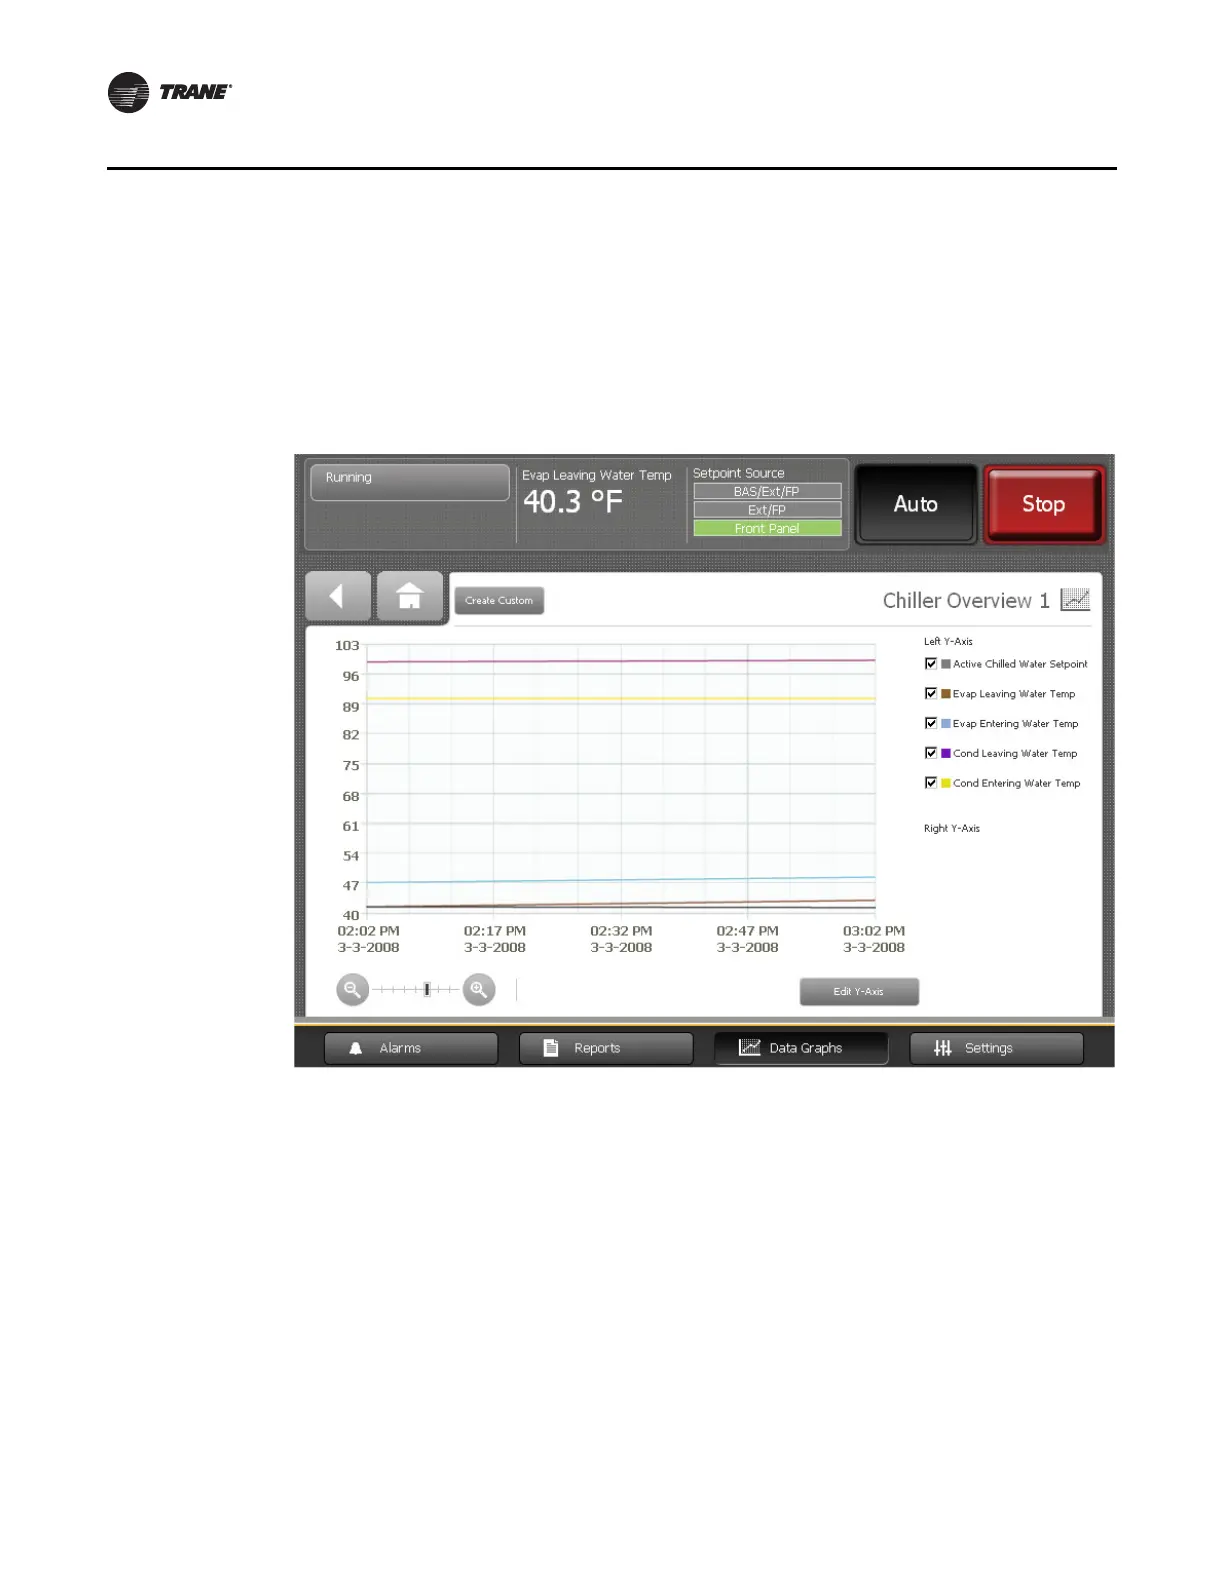
Viewing Data Graphs
On the Data Graphs screen, touch any of the buttons to view a live graph (Figure 12 shows
Chiller Overview 1 as an example). For every graph, the X-axis shows time. The Y-axes
presents data points specific to each graph. The data points are listed in “Data Graphs,”
p. 27.
Changing the Scales on Data Graphs
You can change the scales of the X-axis and the Y-axes on data graphs.
Changing the scale of the X-axis
The X-axis scale defaults to the most recent one hour with 15 minutes in between the time
labels that appear across the bottom of the graph. You can change the scale from the last
12 minutes to the last 48 hours and increments in between, as follows:
• 12-minute graph with 3 minutes between time labels
• 40-minute graph with 10 minutes between time labels
• 60-minute graph with 15 minutes between time labels
• 4-hour graph with 1 hour between time labels
Figure 12. Example of Data Graph (Chiller Overview 1 shown)
 Loading...